The Gold Report: As you noted in your last interview with The Gold Report in February, Goldman Sachs was predicting that gold would to go down to $1,200/ounce ($1,200/oz) in several years, and now “Dr. Doom,” Nouriel Roubini, says it’s going to $1,000/oz. What’s your view?
Chen Lin: In the near term, I think gold is being controlled by the paper market on Wall Street, which is unfortunate. However, I’m still bullish for the long run.
2012 2013
has been the top of cycle..
with the imminent correction still in mending
USA election done
smell of war in israel??
yet this market got to get a life
DOWJones chart analysis to be released
Trading Rules
trading Rules - Be Aware SP and DOWJones are far to high - a correction of 20 % is pending any time,,Timing the USA election **** end of iron ore boom *** fall in big stocks favor the come back of pennyshares****
DOW JONES WATCH FORECASTS
SOON FINANCIAL 2013
Best Six Months for Stock Market Are Underway Says Hirsch
According to the Stock Trader's Almanac, November is the beginning of the stock market's strongest six-month period. The "Best Six Months Switching Strategy" goes like this: Invest in the Dow and/or S&P 500 between November 1 and April 30 each year, then switch into safer fixed income assets in May.
"We found that most of the market's gains are made from November to April, whereas you either go down or are flat from May through October; hence the sell in May and go away[strategy]," says Jeff Hirsch, editor-in-chief of the Stock Trader's Almanac.
Historically, there's a soft period from May through October, as seen in STA's chart below.
"We like to buy in October and get ourselves sober, even though we didn't get our trigger this year because the market was vacillating quite a bit," says Hirsch. He uses a MACD indicator as a trigger for buy and sell moves. Using the MACD, the DJIA's Best Six Months rises to an average gain of 9.3% versus a loss of 1.2% during the Worst Six Months.
On average as seen in the chart below, the Dow Jones Industrial Average has risen 7.5% during the Best Six Month period since 1950, versus 0.3% rise during the Worst 6 Months.
"Last year everyone was bearish — I was one of the lone bulls on the Street. I was really happy with our buy signal," says Hirsch. "This year I'm not so confident because the market technically is struggling against resistance; there are a lot of issues, there's a post-election year coming up, there's fiscal cliffs. So we're going in with tighter stops with our trades this year."
Needless to say, November is off to a very weak start with the DJIA, S&P 500 and Nasdaq all down over 4% month-to-date. Hirsch has already warned of risk in 2013 based on the election cycle and historical weakness when an incumbent president is re-elected.
"Again, we're at the sour spot of the four-year [presidential election] cycle," he admits. "We'll make our trades, but we'll be a lot more cautious and keep the stops a lot tighter instead of leaving it wide open here."
If this is as good as it gets, maybe that's a sound warning for the year ahead. How are you positioning for 2013? Let us know in the comment section below or visit us on Facebook!
STOCK ALERT Markets are constantly in a state of uncertainty and flux ... money is made by discounting the obvious and betting on the unexpected' ~G. Soros
The biggest risk in life is not to have one. Investment Watch Blog Australia Penny Shares companies are managed by the worth CROOKS of the system,, most of it wheeling and dealings to clean the holders?? most of them are INsiders/ traders.. ACCOUNTANTS AND CORPORATES LAWYERS,, protected by ASIC Shame on them >> TRADE WITH THEM >> DO NOT HOLD THEM>> i call them professionals criminals THEY ARE DESTROYING PEOPLE WEALTH AS 4 November 2011 MARKETS SENTIMENTS BULLISH see updated forecasts chart...DOW TESTING 11400 support, Warning *********************************************************
MARKET SIGNALS IN CORRECTION..WAITING FOR THE STORM TO SETTLE.. WATCHING SUPPORT FORMATIONS.. MARKET COULD RALLY BY YEAR END short term TARGET DOW 10400 - SP500 900 long term
go the dragon
If you're looking to invest in penny stocks that aren't part of some "pump and dump" scam, then I've got something you'll be very interested in... sign in and request
Dowjones first support 11900,, on the test *** 12500 ** median line channel broken elliott wave blog
THE ART OF STEALING FROM SHARE HOLDERS
As a publicly listed company we are governed by the ASX Listing Rules and the Corporations Act and as you would appreciate, there are likely to be some matters that are in the process of being finalised that may be market sensitive. In such circumstances it would not be permissible to make disclosures to you until those matters are concluded and announced to the market,, the law protect ASIC and ASX just playing with your money
well that a hard one ,, but get ready in case we may have a surge? technical speculator page VIX reverse sharpely TAX adjustements done??.Happy New Year? 2012 could be a slow start /pending DowJones correction? the words are Correction.. recession ... and fears of Depression MOST DIRECTORS ARE ROBBERS ON ASX Dowjones in correction mode.>> next support?? correction = recession = depression ?? 3 support scenario possible? Astute accounting taking place link to cycles theory WARNING SIGNALS GIVEN ON THE RISING FLAG (3 months periode) Quote of the moment?? Buying time is upon us.... Everone is getting more and more fearful which leads me to think we are getting closer to this downturns bottom. I'll be buying more as funds free up.
the headings and updates , as they are updated, are filed here
11/08/2011 WORLD MARKET TAKING THE DIVE *** OUR SUPPORT BROKEN .. LOOK AT DOW MONTHLY CHART *****MARKET SIGNALS trending down DOW SUPPORT 10650 click for latest update***Daily Dow Jones Shows No Concrete Signs Of Sustainable Rebound.****as at 17 june 2011***The bears are back, and they're talking recession 20/06/2011**** ALERT****THE VIX BOUNCE SHARPLY****24/06/2011 count down watch**** 5 years DJI charts *** stocks picking starting soon****3 more days to update your Accounting*****27/06/2011*** DOW up from support 11900****Good bounce , waiting the test 11800*****12500 Median channel line target**** caution required**** important support 12400*****
Market Minute: January 29, 2012: The "January Effect" and the probabilities
for 2012
The strength in the S&P 500 this month tells more about
the performance for the rest of the year than most investors realise. Over the
last 40 years, whenever the US market has had a return above 3.75% in January,
the S&P 500 finished the year higher. Currently, the index is up 4.44%.
Since 1970, there has been 13 times when the US market has been above 3.75%
in January. Every time the index completed the year with a substantial
gain.
The 13 Januarys with returns of 3.75% or greater were in 1971, 72,
75, 76, 79, 83, 85, 87, 88, 89, 91, 97 and 99.
The average gain for the
rest of the year was a surprising 19.6%. This means that if this January can
finish above 1307.25, then there is a very strong probability of the index going
higher in 2012. And as there are only two more trading days left this month, the
US market would have to drop 10.77 points or more to cancel out the effect.
Bottom line: The S&P 500 has gained 4.44% in January. With two days
remaining, the probability of a good performing 2012 is building. If the US
index can close out the month above 1307.25, then there is a strong likelihood
of another 15% gain by year-end based on 40 years of data.
Investment
approach: The odds for a promising 2012 are mounting. If the S&P 500 does
perform well, as the last 13 Januarys with a 3.75% would suggest, then investors
may wish to remain fully invested this year to take advantage of the anticipated
rise.
From an intermarket perspective, it is also worth noting what
happens when the US markets moves up. The US dollar index and bond prices
normally move in the opposite direction to the S&P 500. Commodities are
closely coordinated with equities. If the stock market advances this year, so
should base metal, gold, silver, oil and agricultural grain prices.
Also, there is a shift out of defensive sectors such as consumer
staples, healthcare and utilities and a move to growth industries like
technology, energy, mining, consumer discretionaries, construction and basic
industry.
More research on commodities and the markets will be in the
upcoming February newsletter.
Donald W. Dony, FCSI , MFTA
WATCH GOLDMAN SACHS AGAIN???
all their forecasts go opposite direction
2011 they forecasted a great year
2012 they forecasting a down year
they are markets manipulators connected to governement
There is a shocking Dow Jones predictions for 2012: (sources: internet news websites):
Analyst Goldman Sachs predicts a major military developments in late 2012 and urges its clients to dump shares.
Last year Fox Business Channel for the first time publicly announced planned for the end of 2012 the great war. A former senior analyst and forecaster of the most influential financial services company Goldman Sachs, said a leading dumbfounded that his clients should begin to dump securities, as the military events of late 2012 would entail a major meltdown of financial markets. Anviktori published translation of the article Paul Watson, Infowars.com editor of this information megabombe, fell in a studio FoxBusiness network.
Massive conflict will cause the collapse of the securities market, strategic analyst forecasts Nenner. Yesterday, when the forecaster Charles Nenner told Fox TV (Fox Business network) about what the Dow Jones (Dow Jones) come down to the level of 5.000 because of major military events that shake the world in late 2012, Fox TV hosts David and Elizabeth MacDonald, Esma froze in shock.
Ferrara outlook 2012
Our economic outlook
An editorial opinion by Troy Frerichs, CFA® Senior Investment Officer
January 5, 2012
A fresh start is what many investors are thinking about after leaving 2011 behind. While overall returns were flat-to-positive over the full year, the headlines and associated market volatility left most feeling exhausted.
After a third quarter in which we saw the S&P 500 decline 13.9% and 10-year U.S. treasury rates drop to 1.9% over concerns in Europe, a U.S. sovereign debt downgrade, political disarray in Washington and anemic U.S. economic growth, we had a fourth quarter that reversed most of the damage. While the European overhang was and is still present, improving U.S. economic data led to the S&P 500 gaining 11.8% during the fourth quarter. The bond market told a different story, however, with rates on 10-year treasuries remaining virtually unchanged from the third quarter, seemingly unwilling to accept the better U.S. economic data in the face of the festering European debt crisis.
So once the dust settled, where did that leave us for 2011? In the stock market, virtually the same place that we started, as the S&P 500 ended the year flat, not including a return from dividends (total return of 2.11%). In the bond market, the Barcap U.S. Aggregate Bond Index (a good proxy for the overall bond market) reflected the nearly 2.00% drop in 10-year treasury yields over the course of 2011 and ended the year with a 7.84% total return. Within U.S. stocks, growth stocks outperformed value stocks, and large capitalization stocks outperformed mid- and small- capitalization stocks. Defensive economic sectors of the U.S. market performed best including utilities, consumer staples and healthcare, while more cyclical sectors -- such as materials, industrials and financials -- underperformed the broad market. U.S. stocks also outperformed those of Europe, Japan and emerging markets. Most sectors of the bond market were positive, with safe haven sectors such as treasuries, municipals, TIPS and investment grade corporates performing best.
So what will we do with our fresh start? With the major caveat that the European debt crisis doesn’t spread to the rest of the world, we anticipate 2012 to be a lot like 2011. We think stocks look relatively attractive as investors come to terms with the fact that there is some growth in the U.S. economy. There is a long list of positives going into 2012 like Real GDP that is at an all-time high, record corporate earnings, an improving employment picture, strong consumer spending, a pickup in manufacturing activity, low interest rates, tame inflation, and an election year (typically good for stocks). However, that could all be wiped out with a complete meltdown in Europe. At the same time, it is difficult to be excited about bonds, particularly treasuries, with yields near all-time lows. When everyone wants something, it usually gets expensive, and right now, we think investors are paying a premium for safety.
People who achieve financial security rarely do so alone
With all of the current economic uncertainty, this is a perfect time to contact your financial representative for an in-depth review of your situation. Backed by a team of experts, your financial representative is equipped to give you the guidance you need.
one of my favorite professors of economy is PR Nouriel Roubini
Listening to Republican presidential candidates and soon-to-be candidates earlier this week, one might conclude America is going down the tubes, or maybe already has.
Now, along comes New York University economics Prof. Nouriel Roubini, who sees a perfect storm of global events that could complete the down-the-tubes journey, not just for America, but for the rest of the global economy as well.
Among Prof. Roubini’s storm fronts is (1) a fragile U.S. economic recovery, coupled with a mushrooming debt, (2) looming economic problems in China, (3) debt issues eroding government stability in Europe, and (4) Japan’s moribund economy due to a crippling national disaster.
For those who never watched the film “The Perfect Storm,” it was a fictionalized version of a real perfect storm that stuck the U.S. Northeast coast in October 1991, when competing weather fronts clashed to create, well, the film’s title says it all — disparate forces coming together from different directions, making the whole much more devastating than the parts.
Roubini sees the global economic forces lining up for just such an event, possibly as early as 2013. In fact, sounding more like a Vegas oddsmaker than an economics professor, he insists the chances of a global collapse are one in three.
OK, he’s got our attention. But when you think about it, a one-in-three chance means there’s a two-in-three chance there won’t be a planet-wide economic meltdown. In gambler’s terms, that’s not so bad.
The problem is that the world’s decision makers continue to kick the can down the road, a point made in a Bloomberg Internet report on Roubini’s bold prediction, which provoked one ‘net blogger to opine:
“Ever feel like YOUR can is getting kicked down the road?”
He was referring to the public’s inclination to accept as fact the direst predictions from economists, turning a best-guess estimate into a full-blown, self-fulfilling prophecy.
There is one enduring fact about economists predicting future events — they usually give you the worst case, then mitigate the impact by offering various alternatives.
For example, Roubini seems particularly pessimistic about the future of the global economy — with his 33-percent chance of complete failure — while in the next breath he points out that, if the worst doesn’t happen, the global economy will continue to be anemic, but will be OK, or he can envision a scenario in which the global economy actually improves, considerably.
Like most economists, the professor is hedging his bets, which should make everyone feel better about the potential for a meltdown. Roubini was, however, the economist who first predicted, in 2006, a catastrophic global financial meltdown. Two years later, Lehman Brothers Holdings Inc. imploded, igniting the economic firestorm that sank the global economy to depths not seen since the 1930s.
So, what does all this mean? Are we to prepare for a perfect storm, full recovery or something in between?
Perhaps the answer lies not in the possible outcomes, but in the dynamics that compelled the good professor to wax gloomy in the first place — his belief that governments have been deferring the tough economic decisions for too many years, kicking the can down the road, a chain of events that has an inevitable doomsday feel to it.
The world has been on a spending spree for far too long, and Americans and their government are among the worst offenders. The bills are coming due, and we have no checks to put in the mail.
Fears over pace of global economic recovery weigh on stock markets
By Pan Pylas, The Associated Press – 5 days ago
LONDON — Concerns over the U.S. economic recovery and expectations China will raise interest rates again weighed on stock markets Monday, while the euro was steady at the start of a potentially crucial week in the Greek debt crisis.
Over the past month, the economic newsflow has turned distinctly negative, particularly out of the U.S. Investors are now worried that the mark up in share prices in the early part of the year may have been overdone — stocks are effectively a leading indicator of economic output for the period ahead.
Nouriel Roubini, a New York University economics professor notorious for predicting the 2008 financial crisis, cautioned against risky investments.
"In the last month, things have changed, the evidence is that maybe this is not just a soft patch but something worse," he said in a speech in Singapore. "If your horizon is the next two or three months, I would be a bit defensive on equities...This is time to be cautious, and safe rather than sorry."
In Europe, the FTSE 100 index of leading British shares was up 0.2 per cent at 5,777, while France's CAC-40 rose 0.1 per cent to 3,809.22. Germany's DAX fell 0.1 per cent to 7,065. Trading activity in Europe was low as many countries, including Germany and France, were on national holiday though stock markets remained open for business.
Wall Street was poised for a lacklustre opening — Dow futures were up 0.1 per cent to 11,885, while the broader Standard & Poor's 500 futures rose an equivalent rate to 1,265.
Given the public holidays in many parts of Europe and a light economic calendar in the U.S., analysts were skeptical that stocks would gain any momentum over the day.
Tuesday may have more to offer, with Chinese inflation data likely to stoke concerns that the People's Bank of China will tighten monetary policy again soon. U.S. retail sales figures for May will also provide an insight into the state of the U.S. economic recovery — consumer spending accounts for around 70 per cent of the U.S. economy.
"All stock markets remain under pressure going into this week, and in the short-term at least, it is difficult to see the catalyst that is going to spark off a sustainable rally," said David Jones, chief market strategist at IG Index.
In the currency markets, investors continue to monitor any developments surrounding the Greek debt crisis ahead of next week's meeting of eurozone finance ministers in Brussels, where a fresh Greek bailout is on the agenda.
On Friday, the euro tanked amid signs that policymakers in Europe have divergent views on how to deal with the Greek crisis, with the European Central Bank and the German government at odds on getting Greece's bondholders to share some of the pain in helping the country.
Germany's finance minister Wolfgang Schaeuble has proposed that bondholders contribute a "substantial" portion of a fresh bailout package for Greece by giving the country an extra seven years to repay existing bonds. But European Central Bank president Jean-Claude Trichet has said nothing should be done that would be deemed "a credit event" by the ratings agencies and that any private sector involvement has to be done on a voluntary basis.
"A failure to achieve a workable agreement by the end of the eurogroup meeting next Monday threatens the real risk of what Schaeuble described last week as the first unorderly default within the eurozone," said Simon Derrick, senior currency strategist at the Bank of New York Mellon.
By late morning London time, the euro was up 0.1 per cent at $1.4355. That's three cents lower than the one-month highs it reached only last Thursday.
Earlier in Asian trading, Japan's Nikkei 225 dropped 0.7 per cent to close at 9,448.21 after the government reported that core machinery orders fell unexpectedly by 3.3 per cent during April. The drop came as companies cancelled orders following a devastating March 11 earthquake and tsunami in northeastern Japan that destroyed or damaged scores of factories.
The decline was the first in four months, evidence that the twin disasters continue to take their toll on Japan's economy. The seasonally adjusted figure includes heavily electrical machinery, engines, machine tools, road vehicles and aircraft but excludes orders for ships and utilities because of their volatility.
South Korea's Kospi closed 0.1 per cent higher at 2,048.74 while Hong Kong's Hang Seng Index finished 0.4 per cent higher at 22,508.08.
But mainland Chinese shares edged lower as market players reacted to data showing a dip in bank lending and awaited the inflation figures that could show the consumer price index surging to more than 6 per cent.
The Shanghai Composite Index fell 0.2 per cent to 2,700.38 after dipping more than 1 per cent earlier in the day. The Shenzhen Composite Index fell 0.2 per cent to 1,110.89.
In the oil markets, crude continued to fall on concerns over the global economic recovery and speculation that Saudi Arabia will decide to raise production levels despite last week's surprise decision by the OPEC oil cartel to maintain current levels.
Benchmark oil for July delivery was down $1 at $98.32 a barrel in electronic trading on the New York Mercantile Exchange.
____
Pamela Sampson in Bangkok contributed to this story.
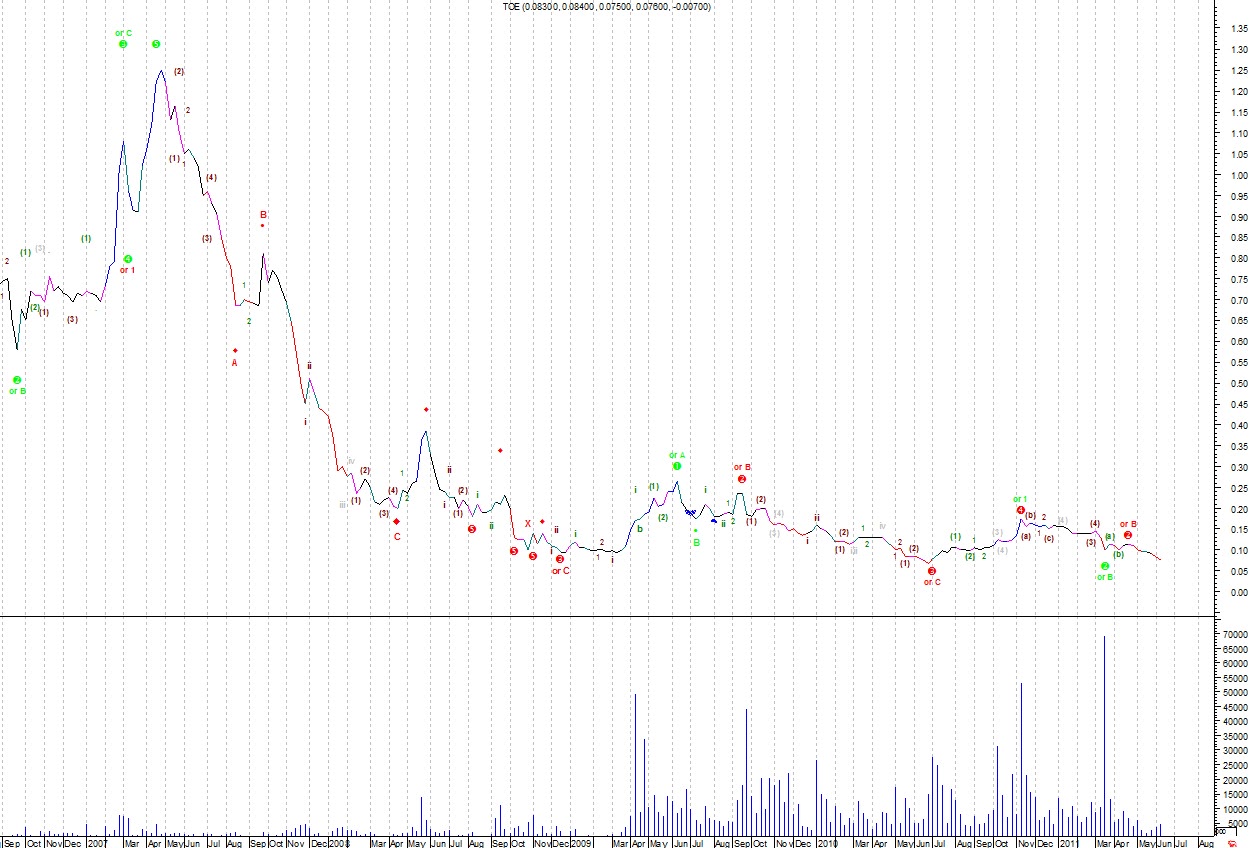
TOE ENERGY TOE Follow your heart or follow the Chart stock to watch on Elliott Waves principle? once the baby of fund managers at the dollar mark, now forming a support line maybe ? will uranium get over the late publicity? corporates activities: 900 millions shares on issue - 32 millions cash bank - issued about 4 millions options to directors ex @ 22 from now valid 5 years??? is it a trap or a sweetner??? for sure Toe energy was a wank?? on the stock pick?? advisory scene.. Elliott wave again was right??
click on chart to enlarge
stock to watch COUGAR METALS CGM
257 millions outstanding small gold producer- balance sheet is sutained positive- gold price high but
they say will go higher?? all charts look good with drawing support - Elliott wave indicate a bottom signal
WGP Western Gas
stock to watch ,, has been rerated before. waiting to see if WGP will deliver
NWE drilling are the hints
AQC australia pacific coal
speculative play
with highly regarded coal leases in good neighbourhood..
very well connected management in the capable hand of Mr PaulByrne..
the chart is high, yet seems to be well supported at 6 level???
a multibagger in formation
subscribe for more infos
GOLDEN CROSS GCR Kim Stanton and his team are confident about developping a copper and gold mine??? capping at 2.2
options expiring at march end 4 cents
got to trigger a play to support financials?????
waiting for developpements
RMG ZINC and Copper projects... VIP stable ... i say no more... Holloman group USA the chart is a bit high,,, hanging there and waiting there.. must be a big BANG soon.. 2 projects in the making they say??? need a breakout >>>>
Somnomed SOM dental applications Peter Neudstadt magic a company maker expecting sustain growth world wide in the field end of June cross accounting indicate that some one want to keep them not selling them
Remember the book that came out at the top of the dot.com mania in 1999 with the title, "Dow 36,000"? Within six months of publication, the stock market bubble burst and that prediction didn't come close to being fulfilled. One of the book's authors is now trying to make amends with a recent op-ed apology in the Wall Street Journal to introduce his new book, "Safety Net."
Contrast that with an equally bold forecast Robert Prechter made last month that has held up: The Dow Industrials won't break 12,400 this quarter.
Prechter's market call was based not on mania madness, but on a wave pattern that began in the early 1930s. He wrote to Elliott Wave Theorist subscribers on February 15 that the Dow would not break the 12,400 level this quarter for a compelling reason -- because that level is part of a decades-long trend channel that provides a large degree of resistance. In terms of the scale of his vision and the degree of the wave count (what we call a Supercycle Degree), Prechter's forecast is just as bodacious as "Dow 36,000."
Point of fact: Right after he published his forecast, prices in the Dow kept rising that week. In fact, they rose right up to 12, 391 on Friday, Feb. 18.
And then what did they do the following Monday?
They fell off.
And they have continued to fall off to below 11,900 through March 15, 2011.
That's what you call good technical analysis. Forecasting is based on probabilities, so no one gets it right every time. But this is a perfect example of spot-on analysis coming to fruition. Now, we will wait to see if 12,400 will continue to provide resistance to the Dow through the end of this quarter two weeks from now.
Read for yourself how Prechter described the situation last month in this excerpt from the Theorist. (We also provide a chart that subscribers received -- with a few labels deleted.) Then decide whether you should have this same kind of invaluable analysis delivered to your email inbox the middle of every month. For a limited time, you can start the Financial Forecast (which includes the Theorist) at a deep discount. Learn more about your special offer.
Excerpted from The Elliott Wave Theorist, published February 15, 2011
Dow is About 100 Points from its Supercycle-Degree Resistance Line
Way back in 1978, Elliott Wave Principle showed the developing trend channel of Supercycle degree. We have been tracking prices with respect to this channel ever since.
As happened in the 1920s, the smaller Cycle degree channel was steep and carried prices above the longer term upper channel line. …[T]he rally into 2007, came back to test the underside of the lower line of that smaller channel.
Now [another] wave is stretching towards the upper channel line of the Supercycle, the one touching the highs of 1937 and 1966. This line denotes a Dow that, from a psychological point of view (not to mention other points of view) is "extremely expensive." The peaks of 2000 and 2007 were "ridiculously expensive."
When prices exceed an upper channel line (in what Ralph N. Elliott called a throw-over) and then fall back below it, they sometimes return to test it before turning down in greater earnest. The April 2009 Elliott Wave Theorist showed an example of such an occurrence in the Gold+Silver Index in 1980.
This quarter, the line cuts through prices at approximately the Dow 12,400 level. Given the wave labeling and the extreme sentiment, the market seems poised to stop near the trendline. Given the importance of this line, the market would almost surely have to accelerate strongly to penetrate it.
[Editor's note: The Dow stopped just short of the 12,400 level at 12,391 on Feb. 18 and has fallen away from that level since.]
Want a Reason to Believe in a Downward-Trending Dow? We are bearish on the Dow, and if you are, too, the best way to find out how to take advantage of a bear market is to read our Elliott Wave financial forecasting service, starting with Robert Prechter's Elliott Wave Theorist. It's always compelling reading. For a limited time, you can start the Financial Forecast (which includes the Theorist) at a deep discount. Learn more about your special offer.
post on finance yahoo.com aq report by Baron.com
IS THE BULL MARKET OVER
A look at four different sentiment measures suggests that more pain may await investors.
Did the bull market end on May 3?
That was when the Dow Jones Industrial Average closed at 12807.51 — which, at least so far, is the Dow's closing high for the rally that began in March 2009. Contrarian analysis can't rule out that possibility. In fact, the behavior of various sentiment indexes in recent months is disturbingly similar to what has happened on the occasion of prior bull-market tops. At least that is what I found after analyzing four different sentiment measures. I looked at the Investors Intelligence weekly survey of newsletter sentiment, data for which extended back to 1963. Specifically, I focused on the ratio of bullish advisors in this survey to the total of those who are either bullish or bearish. I also analyzed the sentiment index maintained by Hulbert Financial Digest (HFD). It represents the average recommended equity exposure among a subset of short-term stock-market timers who are monitored by the HFD. I sifted through the American Association of Individual Investors sentiment survey. As in the case of Investors Intelligence, I focused on the ratio of bullish responses in the AAII survey to the total of those who reported that they are either bullish or bearish. Finally, I focused on the Chicago Board Options Exchange's Market Volatility Index, or VIX. I analyzed how each of these four sentiment indicators behaved on the occasion of past bull-market tops, using the precise definition employed by Ned Davis Research, the institutional research firm. I found that sentiment is remarkably correlated with the stock market. In fact, in nearly half the cases studied, bullish sentiment peaked at almost the same time as the market -- within fewer than five trading sessions before or after. It rarely has peaked more than a month or two before or after the top. Because of this close correlation, sentiment can be used as a reality check on whether a market top has indeed been registered. If more than a few months separate the peak in sentiment and the date of the closing high up until that point, for example, chances are that the final top has not been seen. Another sign that the top has not yet been registered: Sentiment has peaked at much lower levels than those that prevailed at prior tops. Unfortunately, on both grounds it's hard to rule out the suspicion that the May 3 top could be the end of the bull market. According to the Investors Intelligence data, sentiment peaked on April 5, 28 days prior to the exact day of the May 3 high. On April 5, the ratio of bullish advisors to those who were either bullish or bearish came in at 78.5%, higher than the average level of 76.2% that stood on the occasion of prior bull-market tops. According to the HFD survey, sentiment peaked on May 3, the very day of the market's top. The average exposure level then stood at 67.2%, versus an average of 79.6% from prior market tops. According to the AAII survey, sentiment peaked on Dec. 23 of last year, or more than four months prior to May 3. The ratio of bullish responses in the Dec. 23 survey to those indicating that they were either bullish or bearish stood at 79.4%, higher than the 78.7% average from prior tops. According to the VIX, investor optimism reached its apogee on April 28, five days prior to the day of the top. The VIX on April 28 closed at 14.62, which is less than the 15.51 average from prior bull-market tops. Notice that the extreme levels of investor optimism recently reported by the various sentiment indexes are, in three out of the four cases studied, actually higher than the averages seen at prior bull-market tops. Notice also that, in three out of the four cases, the sentiment peak came within only a few days of the market's top. Can contrarian-oriented traders, nevertheless, find comfort in the equity fund flow data? You may recall that those flows provided one of the strongest contrarian-based supports for this bull market in 2009 and 2010, as mutual-fund investors in both of those years pulled more money out of domestic equity funds and exchange-traded funds than they put back in. This year, however, the situation has changed. TrimTabs Investment Research estimates that, following net outflows of $46.9 billion and $51.9 billion in 2009 and 2010, respectively, this year (through June 8) there has been a net inflow totaling $28.8 billion. So we no longer have the strong wall of worry that the bull market last year was able to climb. To be sure, this year's inflows are not as large as those seen at prior bull-market tops. So the flow data are not, in themselves, sending any contrarian-based alarm bells. But, by the same token, those data no longer are providing the strongly bullish foundation that they were in each of the past two years. The bottom line? The sentiment data no longer provide strong contrarian support for a bull market. And a number of the sentiment indexes are, or very close to, flashing outright sell signals. ___
Welcome to Financial YEAR 2012 as we approach the end of financial year 2011, the predictions and forecasts discussed on this blog, were accurate... good luck to the one who sold on top of momentum,, and more good luck are the one who sold 100 % of portfolio...
we are ending 2011 with hughe market write off
and entering 2012 looking for a support
in previous situations, and looking for a directions on DOwJones index with
14-Week Cycle Tops and Money Flow Ts™ Suggest a Mid-February Change in Sentiment
By Parker Binion Sunday, February 6, 2011
This week we will step back and take a look at the big picture. First, here’s a chart showing that the S&P has been making important tops every ~14 weeks over the last year. If the cycle holds true, we can expect the next S&P top in mid-February.
•The trend is your friend.
•And if that trend has momentum, it will be your best friend.
•But that friendship will only hold until the trend turns on you – at which point it becomes your worst enemy.
The "trend" that we're referring to here is market liquidity – and lots of it. All this liquidity is washing through the U.S. economy courtesy of the Obama stimulus package, the "quantitative-easing" strategy of the U.S. Federal Reserve, the just-enacted extension of the Bush tax cuts, a cut in payroll taxes, expanded unemployment benefits and accelerated expensing of capital investments in 2011.
A key point to understand about all this liquidity is that "more is always better sooner." And that's certainly the case here: We don't have to wait and worry about getting these simulative measures in 2011 – they're already in motion.
In this kind of market, fundamentals take a backseat (though they're not totally irrelevant). Liquidity determines the direction of stocks and other asset prices.
And there could be more liquidity to come.
The Fed's Plan For a Happy New Year
In a recent appearance on the CBS News "60 Minutes" program, U.S. Federal Reserve Chairman Ben S. Bernanke declared that the already-existing second round of quantitative easing – referred to by the market moniker of "QE2" – could very well be followed by more of the same.
That's more fuel for the stock-market fire in the New Year.
Liquidity – in all its forms, and all around the world – has been the engine of rising global prices for stocks, bonds, commodities, and even precious metals such as silver and gold.
Much of this liquidity has been stimulus-fueled. The liquidity then drives markets and asset prices higher because most of it ends up being injected into the very pipelines that supply liquidity.
Here in the U.S. market, this is all part of the Fed's "real" plan to "save" the economy. That central bank plan calls for the central bank to:
•Liquefy the banks and all the financial intermediaries.
•Inflate the stock market and create a "wealth effect" where people see stock prices rising and assume the economy is getting stronger.
•Inflate commodity prices so deflationary fears don't destroy consumer spending because shoppers put off purchases, rightly reasoning that prices will be lower later.
In other words, the Fed wants to inflate everything, first by devaluing the dollar, the currency in which oil and most major commodities are priced. Then it plans to continue to devalue the dollar by printing money to make our exports cheap on world markets.
Sure, it's a "liquidity trap," and a momentum shift in the flood of liquidity is the greatest danger to rising equity prices. But as long as every crisis is met with another massive dose of liquidity, the levy will keep rising, until it eventually breaks.
Long before that happens, however, I'll have you out of all your longs and will help you start constructing strategic "shorts." In fact, I'll have all of you short everything.
That change in direction is what I mean when I refer to the prevailing trend "turning on you," and becoming your biggest enemy. That will happen when the liquidity is withdrawn.
In the meantime, there's money to be made through equity investments in different sectors and across different asset classes (courtesy of exchange-traded funds, or ETFs), by going long on positive momentum plays and by shorting some investments about to get the wind knocked out of their sails.
Let's look at some specifics.
Tapping Into Technology
The brightest stock-market star in 2011 will be tech. Right now, the hot growth areas in the world don't include the U.S. market. But that's okay: A research study of high-tech firms in the Standard & Poor's 500 Index conducted by top-tier market researcher Bespoke Investment Group found that 54% of the gross revenue recorded in 2009 was derived from international markets.
What is spectacular about tech is that technology combines global growth prospects with every company's need to improve productivity gains through advanced applicable technologies. That's everywhere. What's more, here in the U.S. market, a major corporate tax break for capital investments in technology, factories and other equipment will serve as an added tailwind to drive tech sales – and tech stocks – even higher.
U.S. companies are sitting on nearly $2 trillion in cash – their biggest hoard in 51 years. And tech firms boast some of the biggest caches of cash. As a percentage of total assets, their cash holdings are highest among all S&P 500 industry groups. Whether they use their cash to pay dividends, buy back stock, or embark on merger-and-acquisition deals – all of which we're already seeing – tech-stock investors figure to be the big beneficiaries.
There are plenty of great tech companies and slices of the tech pie. Personally, my favorite trends are cloud computing and data storage. But, maybe the easiest and broadest approach is the best. I like buying the Nasdaq Composite Index in the form of PowerShares QQQ Trust ETF (Nasdaq: QQQQ).
Put a Charge Into Your Portfolio
Energy – specifically oil, the drillers and integrated multinational giants – is poised to soar in the New Year, especially if the emerging markets stay healthy, Europe stabilizes, and the U.S. recovery hits its stride.
With a modicum of inflationary fear back in the spring and summer of 2008, oil rose to more than $145 per barrel. Given the devaluation of the U.S. dollar and rising commodity prices worldwide, crude oil is almost certain to zoom beyond its current trading range at about $85 to $89 a barrel.
The Organization of the Petroleum Exporting Countries (OPEC) has announced a target price of $90 a barrel. Given that oil was trading at $89 yesterday (Tuesday), this looks ridiculously low if demand increases as global economies recover.
ConocoPhillips (NYSE: COP) and Chevron Corp. (NYSE: CVX) are poised to rise handsomely in tandem with the price of oil. So are a few of the drillers, especially the deepwater drillers. Transocean Ltd. (NYSE: RIG), in particular, looks cheap. If the company can escape the worst of the fallout from the Gulf oil spill, it could be a big winner.
Materials, Commodities and Precious Metals Plays
The materials sector is also in good shape to benefit from a U.S. recovery and global growth. S&P 500 materials-based companies derive 45% of their revenue internationally. Rising demand in terms of growing industrial production will put upward pressure on the supply side of materials. I like keeping it simple here and play this big space by buying Materials SPDR ETF (NYSE: XLB).
Commodities investments were once the purview of the high-net-worth investor only. Today, however, every investor needs to have money invested in this crucial sector. We covered oil as part of our energy strategy (and oil, by the way, constitutes a major weighting in most commodities index funds, so be careful not to overweight your portfolio with more "black gold" than you are comfortable with).
Other key commodities groups include agriculture, minerals, livestock and metals (not including precious metals) – of which can be invested in via ETFs.
In agriculture, for example, there is the PowerShares DB Agriculture ETF (NYSE: DBA) and the MarketVectors Agribusiness ETF (NYSE: MOO).
Mostly, I like copper, cocoa, corn and cotton.
For corn, take a look at the Teucrium Corn Fund (NYSE: CORN). If you are an international investor, or have access to the London markets, the ETFS company has a series of ETFs based on the corn futures markets, including the ETFS CORN Fund (LON: CORN.LN).
With cotton, there's the iPath Dow Jones-AIG Cotton Total Return Sub-Index ETN (NYSE: BAL), which is based on the total return sub-index for cotton. It is based on the return of a single futures contract in cotton.
I also like some of the minerals and metals. There are ETFs for palladium [the ETFS Physical Palladium Fund (NYSE: PALL)] and for platinum [the ETFS Physical Platinum Shares (NYSE: PPLT) ETF]. Platinum, by the way, is a metal whose potential we've written about extensively in past issues of Money Morning.
The only caveat to loading up on commodities as we enter 2011 is that they've had a big run already and while I expect momentum to continue, there's a big wild card out there (more on that later) and I suggest either buying small and adding to positions later, or waiting until April to see if the Fed is going to keep the "QE" ship sailing at full speed.
Then there are the precious metals. I like gold, just not in over abundance. A 10% allocation to gold is never going to hurt you and it stands to be a steady winner as long as currency wars and a decimated euro bring the "store of value" discussion to Main Street investors. Money Morning has published special reports on silver and gold investing.
Playing the Downside
As I explained earlier, there is a potential downside when the trend is no longer our friend. And there's also downward momentum, which comes after upward momentum sputters.
Unless we are headed into another global meltdown or experience a devastating shock to financial markets, bonds have had their ride.
Treasury yields have backed up considerably since QE2 began. While the Fed was trying to keep interest rates low by buying Treasuries and flooding the system with liquidity, bond prices actually fell and yields rose – a lot! If the Fed is successful, or in spite of its efforts, U.S. growth gains traction and global demand for investment capital continues, rates have nowhere to go but up.
Over a trillion dollars have been invested in Treasury bonds since the fall of 2008. That safe harbor isn't going to look so safe when investors open up their fourth quarter statements and see they have losses in their bond holdings. If stocks keep rising and bond prices keep falling, there will be a capital wave out of bonds that just might upend world stability. We'll cross that bridge if we get there, but to ride the downward momentum in Treasury bonds I recommend buying ProShares Short 20+ Treasury ETF (NYSE: TBF).
Another mind-bending momentum-mayhem possibility is an exodus of investors from the municipal bond market. There's no escaping the fact that almost all U.S. states are making ends meet by means of federal handouts. County and municipal governments are almost all out of money and deep in hock.
Rising rates will be the canary in the coal mine, signaling a possible default – or, more likely, several high-profile defaults – if the Fed and the U.S. Treasury Department don't open up the spigot and keep liquidity flowing into the financial system.
If you're a muni-bond investor, think about hedging or cashing out. The timing on this one will be difficult, but it's coming. Because timing on the municipal front is so difficult, I'm not inclined to recommend what to short right now. But I will offer an update on this subject, with specific recommendations, later in 2011.
Lastly, there's the euro, the currency of the European Union. The euro has been weak lately after bouncing to heights that didn't make any sense after last summer's Greek debt woes subsided. What didn't make sense is that the euro climbed even on the heels of news about Ireland. Not until fears arose that Portugal and Spain could be next to need emergency first aid did the euro start to falter again.
The euro has nowhere to go but down. I like buying three-month-out "calls" on the ProShares UltraShort Euro ETF (NYSE: EUO). This fund is a leveraged, double-short ETF that is designed to move twice as much as the cash market for the euro currency against the dollar. That means that if the euro is falling in value relative to the dollar, EUO will rise in price.
Key Caveats
As we head into 2011 with positive momentum, there are some key warning signals that we need to watch for – since they would serve as warnings of a reversal in momentum. These warning signals include:
•Any sovereign defaults anywhere in the world.
•National governments or cross-government unions backing away from debt support and liquidity-supply measures.
•Or any serious banking or financial markets crises in China.
There are plenty of reasons to be optimistic about 2011, and a few mayhem makers that can turn things upside down.
So just remember this: Your friends are only your friends until you can't trust them any more.
[Editor's Note: Shah Gilani, a retired hedge-fund manager and renowned financial-crisis expert, has made some astounding market calls. Take his forecast for the 2009 U.S. economy. He predicted a steep decline in both the economy and the stock market – followed by a steep rebound in stocks. And that's just what happened.
Not long ago, in a Money Morning exposé, Gilani warned that high-frequency traders (HFT) were artificially pumping up market-volume numbers, meaning stocks were extremely susceptible to a downdraft.
When that downdraft came, Gilani was ready - and so were subscribers to his new advisory service: The Capital Wave Forecast. The next morning, because of that market move, investors were up 186% on a short-term euro play, and more than 300% on a call-option play on the VIX volatility index.
Now Gilani has crafted a stock-market strategy for the New Year. It's worth a look. If you like what you see, take a close look at his Capital Wave Forecast advisory service. You'll find it was time well-spent.]
Disclaimer: Nothing published by Money Morning should be considered personalized investment advice. Although our employees may answer your general customer service questions, they are not licensed under securities laws to address your particular investment situation. No communication by our employees to you should be deemed as personalized investent advice. We expressly forbid our writers from having a financial interest in any security recommended to our readers. All of our employees and agents must wait 24 hours after on-line publication, or 72 hours after the mailing of printed-only publication prior to following an initial recommendation. Any investments recommended by Money Morning should be made only after consulting with your investment advisor and only after reviewing the prospectus or financial statements of the company.
before you buy into a stock story,
you should be aware that those corporates players need your money ...
first
to get paid exhorbitant wages to do very little
second
they live holders on hope while insiders sell into it..
that way most of stocks go down on good news..
so for every stock i buy
i do a test drive
position of the general market
the story of the stock.. project
the one year chart
the three year chart
the 5 years chart
the structure of the company
the balance sheet
the liabilities
cash balance/ versus latest placement
the burning rate
REMEMBER MOST OF YOUR DIRECTORS ARE CON MAN
The Deadly art of Stocks manipulations?? Asic pretend all done according to the law??? every stocks got insiders manipulators well aware of the law??
THE DEADLY ART OF STOCK MANIPULATION by: Unknown
In every profession, there are probably a dozen or two major rules. Knowing them is what separates the professional from the amateur. Not knowing them at all? Well, let’s put it this way: How safe would you feel if you suddenly found yourself piloting (solo) a Boeing 747 as it were landing on an airstrip? Unless you are a professional pilot, you would probably be frightened out of your wits and would soil your underwear. Hold that thought as you read this essay because I will explain to you how market manipulation works. What the professionals and the securities regulators know and understand, which the rest of us do not, is this
RULE NUMBER ONE:
ALL SHARP PRICE MOVEMENTS -- WHETHER UP OR DOWN --ARE THE RESULT OF ONE OR MORE (USUALLY A GROUP OF) PROFESSIONALS MANIPULATING THE SHARE PRICE.
This should explain why a mining company finds something good and" nothing happens" or the stock goes down. At the same time, for NO apparent reason, a stock suddenly takes off for the sky! On little volume! Someone is manipulating that stock, often with an unfounded rumor. In order to make these market manipulations work, the professionals assume: (a) The Public is STUPID and (b) The Public will mainly buy at the HIGH and (c) The Public will sell at the LOW. Therefore, as long as the market manipulator can run crowd control, he can be successful. Let's face it: The reason you speculate in such markets is that you are greedy AND optimistic. You believe in a better tomorrow and NEED to make money quickly. It is this sentiment which is exploited by the market manipulator. He controls YOUR greed and fear about a particular stock. If he wants you to buy, the company's prospects look like the next Microsoft. If the manipulator wants you to desert the sinking ship, he suddenly becomes very guarded in his remarks about the company, isn't around to glowingly answer questions about the company and/or GETS issued very bad news about the company. Which brings us to the next important rule. RULE NUMBER TWO:
IF THE MARKET MANIPULATOR WANTS TO DISTRIBUTE (DUMP) HIS SHARES, HE WILL START A GOOD NEWS PROMOTIONAL CAMPAIGN.
Ever wonder why a particular company is made to look like the greatest thing since sliced bread? That sentiment is manufactured. Newsletter writers are hired -- either secretly or not -- to cheerlead a stock. PR firms are hired and let loose upon an unsuspecting public. Contracts to appear on radio talk shows are signed and implemented. Stockbrokers get "cheap" stock to recommend the company to their "book" (that means YOU, the client in his book). An advertising campaign is rolled out (television ads, newspaper ads, card deck mailings). The company signs up to exhibit at "investment conferences" and "gold shows" (mainly so they can get a little "podium time" to hype you on their stock and tell you how "their company is really different" and" not a stock promotion.") Funny little "hype" messages are posted on Internet newsgroups by the same cast of usual suspects. The more, the merrier. And a little "juice" can go a long way toward running up the stock price. The HYPE is on. The more clever a stock promoter, the better his knowledge of the advertising business. Little gimmicks like "positioning" are used. Example: Make a completely unknown company look warm and fuzzy and appealing to you by comparing it to a recent success story. The only reason you have been invited to this seemingly incredible banquet is that YOU are the main course. After the market manipulator has suckered you into "his investment," exchanging HIS paper for YOUR cash, the walls begin to close in on you. Why is that?
RULE NUMBER THREE:
AS SOON AS THE MARKET MANIPULATOR HAS COMPLETED HIS DISTRIBUTION (DUMPING) OF SHARES, HE WILL START A BAD NEWS OR NO NEWS CAMPAIGN.
Your favorite home-run stock has just stalled or retreated a bit formats high. Suddenly, there is a news VACUUM. Either NO news or BAD rumors. I discovered this with quite a few stocks. I would get LOADS of information and "hot tips." All of a sudden, my pipeline was shut-off. Some companies would even issue a news release CONDEMNING me ("We don't need 'that kind of hype’ referring to me!). Cute, huh? When the company wanted fantastic hype circulated hither and yon, there would be someone there to spoon-feed me. The second the distribution phase was DONE.... oops! Sorry, no more news. Or, "I'm sorry. He's not in the office." Or, "He won't be back until Monday." The really slick market manipulators would even seed the Internet newsgroups or other journalists to plant negative stories about that company. Or start a propaganda campaign of negative rumors on all available communication vehicles. Even hiring a "contraire" or" special PR firm" to drive down the price. Even hiring someone to attack the guy who had earlier written low about the company. (This is not a game for the faint-hearted!) You'll also see the stock drifting endlessly. You may even experience a helpless feeling, as if you were floating in outer space without a lifeline. That is exactly HOW the market manipulator wants you to feel. See Rule Number Five below. He may also be doing this to avoid the severe disappointment of a "dry hole" or a "failed deal." You'll hear that oft-cried refrain, "Oh well, that's the junior minerals exploration business... very risky!" Or the oft-quoted statistic, "Nine out of 10 businesses fail each year and this IS a Venture Capital Start-up stock exchange." Don't think it wasn't contrived. If a geologist at a junior mining company wasn't optimistic and rosy in his promise of exploration success, he would be replaced by someone who was! Ditto for the high-tech deal, in a world awash with PhD's. So, how do you know when you are being taken? Look again at Rule #1.Inside that rule, a few other rules unfold which explain how a stock price is manipulated. RULE NUMBER FOUR:
ANY STOCK THAT TRADES HUGE VOLUME AT HIGHER PRICES SIGNALS THE DISTRIBUTION PHASE.
When there was less volume, the price was lower. Professionals were accumulating. After the price runs, the volume increases. The professionals bought low and sold high. The amateurs bought high (and will soon enough sell low). In older books about market manipulation and stock promotion, which I've recently studied, the mark-up price referred to THREE times higher than the floor. The floor is the launch pad for the stock. For example, if one looks at the stock price and finds a steady flat line on the stock's chart of around 10p , then that range is the FLOOR. Basically, the mark-up phase can go as high as the market manipulator is capable of taking it. From my observations, a good mark-up should be able to run about five to ten times higher than the floor, with six to seven being common. The market manipulator will do everything in his power to keep you OUT OF THE STOCK until the share price has been marked up by at least two-three times, sometimes resorting to "shaking you out" until after he has accumulated enough shares. Once the mark-up has begun, the stock chart will show you one or more spikes in the volume -- all at much higher prices (marked up by the manipulator, of course).
RULE NUMBER FIVE:
THE MARKET MANIPULATOR WILL ALWAYS TRY TO GET YOU TO BUY AT THE HIGHEST, AND SELL AT THE LOWEST PRICE POSSIBLE.
Just as the manipulator will use every available means to invite you to "the party," he will savagely and brutally drive you away from "his stock" when he has fleeced you. The first falsehood you assume is that the stock promoter WANTS you to make a bundle by investing in his company. So begins a string of lies that run for as long as your stomach can take it. You will get the first clue that "you have been had" when the stock stalls at the higher level. Somehow, it ran out of steam and you are not sure why. Well, it ran out of steam because the market manipulator stopped running it up. It's over inflated and he can't convince more people to buy. The volume dries up while the share price seems to stall. LOOK AT THE TRADING VOLUME, NOT THE SHARE PRICE! When earlier, there may have been X amounts of shares trading each day for eight out of 12 trading days (as in the case of CONROY), now the volume has slipped to X amount shares (or so) daily. There are some buyers there, enough for the manipulator to continue dumping his paper, but only so long as he can enlist one or more individuals/services to bang his drum. He may continue feeding the promo guys a string of "promises" and" good news down the road." (Believe me, this HAS happened to me!) But, when the news finally arrives, the stock price goes THUD! This is entirely orchestrated RULE NUMBER SIX:
IF THIS IS A REAL DEAL, THEN YOU ARE LIKELY TO BE THE LAST PERSON TO BE NOTIFIED OR WILL BE DRIVEN OUT AT THE LOWER PRICES.
Like Jesse Livermore wrote, "If there's some easy money lying around, no one is going to force it into your pocket." The same concept can be more clearly understood by watching the trades. When a market manipulator wants you into his stock, you will hear LOUD noises of stock promotion and hype. If you are "in the loop," you will be bombarded from many directions. Similarly, if he wants you out of the stock, then there will be orchestrated rumors being circulated, rapid-fired at you again from many directions. Just as good news may come to you in waves, so will bad news. You will see evidence of a VERY sharp drop in the share price with HUGE volume. That is you and your buddies running for the exits. If the deal is really for real, the market manipulator wants to get ALL OF YOUR SHARES or as many as he can... and at the lowest price he can. Where as before, he wanted you IN his market, so he could dump his shares to you at a higher price, NOW when he sees that this deal IS for real, he wants to pay as little as possible for those same shares... YOUR shares which he wants you to part with, as quickly as possible. The market manipulator will shake you out by DRIVING the price as lows he can. Just as in the "accumulation" stage, he wants to keep everything as quiet as possible so he can snap up as many of the shares for himself, he will NOW turn down, or even turn off, the volume so he can repeat the accumulation phase. The accumulation phase was TOP SECRET. The noise level was deadingly silent. As soon as the insiders accumulated all their shares, they let YOU in on the secret.
CONVERSELY, YOU WILL OFTEN BE THE LAST TO KNOW WHEN THIS DEAL SHOWS SIGNS OF FAILURE.
Twenty-twenty hindsight will often show you that there was a "little stumble" in the share price, just as the "assays were delayed" or the" deal didn't go through." Manipulators were peeling off their paper to START the downslide. And ACCELERATE it. The quick slide down makes it improbable for your getting out at more than what you originally paid for the stock... and gives you a better reason for holding onto it "a little longer" in case the price rebounds. Then, the drifting stage begins and fear takes over. And unless you have nerves of steel and can afford to wait out the manipulator, you will more than likely end up selling out at a cheap price. For the insider, market maker or underwriter is obliged to buy back all of your paper in order to keep his company alive and maintain control of it. The less he has to pay for your paper, the lower his cost will be to commence his stock promotion again... at some future date. Even if his company has no prospects AT ALL, his "shell" of a company has some value (only in that others might want to use that structure so they can run their own stock promotion). So, the manipulator WILL buy back his paper. He just wants to make sure that he pays as little for those shares as possible.
RULE NUMBER EIGHT:
THE MARKET MANIPULATOR WILL COMPEL YOU INTO THE STOCK SO THAT YOU DRIVE UP ITS PRICE SHARES.
Placing a Market Order or Pre-Market Order is an amateur's mistake, A market manipulator (traders included here) can jack up the share price during your market order and bring you back a confirmation at some preposterous level. The Market Manipulator will use the "tape" against you. He will keep buying up his own paper to keep you reaching for a higher price. He will get in line ahead of you to buy all the shares at the current price and force you to pay MORE for those shares. He will tease you and MAKE you reach for the higher price so you "won't miss out." Miss out on what? Getting your head chopped off, that's what! One can avoid market manipulation by not buying during the huge price spikes and abnormal trading volumes, also known as chasing the stock to a higher price.
THE MARKET MANIPULATOR IS WELL AWARE OF THE MOTIONS YOU ARE EXPERIENCING DURING A RUN UP AND A COLLAPSE AND WILL PLAY YOUR EMOTIONS LIKE A PIANO.
During the run up, you WILL have a rush of greed which compels you to run into the stock. During the collapse, you WILL have a fear that you will lose everything... so you will rush to exit. See how simple it is and how clear a bell it strikes? Don't think this formula isn’t tattooed inside the mind of every manipulator. The market manipulator will play you on the way up and play you on the way down. If he does it very well, he will make it look like someone else's fault that you lost money! Promise to fill up your wallet? You'll rush into the stock. Scare you into losing every penny you have in that stock? You'll run away screaming with horror! And vow to NEVER, ever speculate in such stocks again. But many of you still do.... The manipulator even knows how to bring you back for yet another play. What actors! No wonder Vancouver is sometimes called "Hollywood North."
FINAL RULE:
A NEW BATCH OF SUCKERS ARE BORN WITH EVERY NEW PLAY.
The Financial Markets are a Cruel, Unkind and Dangerous Playing Field, one place where the newest amateurs are generally fleeced the most brutally.... usually by those who KNOW the above rules. Just as I have a duty to ensure that each of you understand how this game is played, YOU now have that same duty to guarantee that your fellow speculator understands these rules. Just as I would be a criminal for not making this data known to you, YOU would be just as criminal to keep it a secret. There will always be an unsuspecting, trusting fool whom the rabid dogs will tear to shreds, but it does NOT have to be this way. IF every subscriber made this essay broadly known to his friends, acquaintances and family, and they passed it on to their friends, word of mouth could cause many of these market manipulators to pause. IF this effort were done strenuously by many, then perhaps the financial markets could weed out the crooked manipulators and the promoters could bring us more legitimate plays. The stock markets are a financing tool. The companies BORROW money from you, when you invest or speculate in their companies. They want their share price going higher so they can finance their deal with less dilution of their shares... if they are good guys. But, how would you feel about a friend or family member who kept borrowing money from you and never repaid it? That would be theft, plain and simple. So, a market manipulator is STEALING your money.


 go the dragon


 VIX reverse sharpely




 Email |
  Print |
  RSS |
RSS |  My Updates


 c
c
