2013 Markets outlook DowJones

2013 Markets outlook DowJones

ferrara outlook013

WILL MARKET RECOVER FOR END FY 2013

CLICK ON ABOVE
WILL THE MARKETS RECOVER 2013
approaching new high quarter 3 2013

End FY 2013 with a scream???

The Gold Report: As you noted in your last interview with The Gold Report in February, Goldman Sachs was predicting that gold would to go down to $1,200/ounce ($1,200/oz) in several years, and now “Dr. Doom,” Nouriel Roubini, says it’s going to $1,000/oz. What’s your view?

Chen Lin: In the near term, I think gold is being controlled by the paper market on Wall Street, which is unfortunate. However, I’m still bullish for the long run.


2012 2013
has been the top of cycle..
with the imminent correction still in mending
USA election done
smell of war in israel??
yet this market got to get a life
DOWJones chart analysis to be released

Trading Rules

Trading Rules
trading Rules - Be Aware SP and DOWJones are far to high - a correction of 20 % is pending any time,,Timing the USA election **** end of iron ore boom *** fall in big stocks favor the come back of pennyshares****

DOW JONES WATCH FORECASTS

SOON FINANCIAL 2013

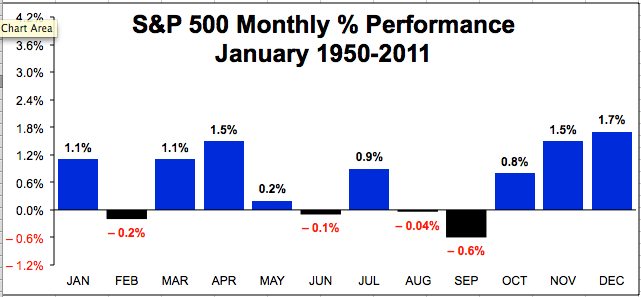
Best Six Months for Stock Market Are Underway Says Hirsch

According to the Stock Trader's Almanac, November is the beginning of the stock market's strongest six-month period. The "Best Six Months Switching Strategy" goes like this: Invest in the Dow and/or S&P 500 between November 1 and April 30 each year, then switch into safer fixed income assets in May.

"We found that most of the market's gains are made from November to April, whereas you either go down or are flat from May through October; hence the sell in May and go away [strategy]," says Jeff Hirsch, editor-in-chief of the Stock Trader's Almanac.

Historically, there's a soft period from May through October, as seen in STA's chart below.


"We like to buy in October and get ourselves sober, even though we didn't get our trigger this year because the market was vacillating quite a bit," says Hirsch. He uses a MACD indicator as a trigger for buy and sell moves. Using the MACD, the DJIA's Best Six Months rises to an average gain of 9.3% versus a loss of 1.2% during the Worst Six Months.

On average as seen in the chart below, the Dow Jones Industrial Average has risen 7.5% during the Best Six Month period since 1950, versus 0.3% rise during the Worst 6 Months.

"Last year everyone was bearish — I was one of the lone bulls on the Street. I was really happy with our buy signal," says Hirsch. "This year I'm not so confident because the market technically is struggling against resistance; there are a lot of issues, there's a post-election year coming up, there's fiscal cliffs. So we're going in with tighter stops with our trades this year."

Needless to say, November is off to a very weak start with the DJIA, S&P 500 and Nasdaq all down over 4% month-to-date. Hirsch has already warned of risk in 2013 based on the election cycle and historical weakness when an incumbent president is re-elected.

"Again, we're at the sour spot of the four-year [presidential election] cycle," he admits. "We'll make our trades, but we'll be a lot more cautious and keep the stops a lot tighter instead of leaving it wide open here."

If this is as good as it gets, maybe that's a sound warning for the year ahead. How are you positioning for 2013? Let us know in the comment section below or visit us on Facebook!

More From Breakout:

Beware of Black Friday Trading: Hirsch

Anatomy of a Fragile Market: What to Make of the Selloff

TURBULENT CORRECTION AHEAD,, NEXT TO 10000
BE AWARE Q4 MARKET ASX CORRECTION JUST STARTED = DOW DID SIGNAL TOP = CORRECTION IN PROGRESS = WATCH COUNT THE WAVES
WATCH THE CROOKS DEALINGS ON PENNTSHARES,,,LOTS OF SCANDALS
DOW JONES WATCH FORECASTS
SPECIAL REPORT THE BULL ARE BACK 2012
Dow Jones managed to break our resistance from 11.600 and now it touched our next one from 12.750.
more upward moves as long as 11.600 holds the market.
For the moment the sentiment in the markets is significant positive so, as long as we don't see a break of our supports, we can keep our

USA ELECTION - USA ECONOMY - EURO CRISIS
MARKET CORRECTION IN PROGRESS...
WAITING NEXT SIGNALS FOR SUPPORT
******* END FINANCIAL YEAR 2012**************


STOCK ALERT
Markets are constantly in a state of uncertainty and flux ... money is made by discounting the obvious and betting on the unexpected'
~G. Soros

The biggest risk in life is not to have one.
Investment Watch Blog
Australia Penny Shares companies are managed by the worth CROOKS of the system,, most of it wheeling and dealings to clean the holders?? most of them are INsiders/ traders.. ACCOUNTANTS AND CORPORATES LAWYERS,, protected by ASIC
Shame on them >> TRADE WITH THEM >> DO NOT HOLD THEM>> i call them professionals criminals THEY ARE DESTROYING PEOPLE WEALTH
AS 4 November 2011 MARKETS SENTIMENTS BULLISH see updated forecasts chart... DOW TESTING 11400 support, Warning
*********************************************************
MARKET SIGNALS IN CORRECTION..WAITING FOR THE STORM TO SETTLE.. WATCHING SUPPORT FORMATIONS.. MARKET COULD RALLY BY YEAR END short term
TARGET DOW 10400 - SP500 900 long term

Milford Sound in New Zealand go the dragon
If you're looking to invest in penny stocks that aren't part of some "pump and dump" scam, then I've got something you'll be very interested in... sign in and request

STOCK ALERT TDX FLAG UP - STOCK TO WATCH

TAKE NOTE THAT THE mARKET SEEMS TO CONSOLIDATE FOR A TURN ??? bIOTECHS SEEMS TO WARM UP??
accumulation on the penny shares,, be aware of consolidation

our chart updates support 1

our chart updates support 1

dow new chart formation warning

dow new chart formation warning
very important level to watch.. be aware of a dip

BEWARE OF CORPORATE CON MAN AT WORK

Dowjones first support 11900,, on the test *** 12500 ** median line channel broken
elliott wave blog

THE ART OF STEALING FROM SHARE HOLDERS
As a publicly listed company we are governed by the ASX Listing Rules and the Corporations Act and as you would appreciate, there are likely to be some matters that are in the process of being finalised that may be market sensitive. In such circumstances it would not be permissible to make disclosures to you until those matters are concluded and announced to the market,, the law protect ASIC and ASX
just playing with your money
KEEP IN MIND 90 % CORPORATE AUSTRALIA ARE CRIMINAL CROOKS ALONG WITH CORPORATE LAWS
link to ART OF STOCKS MANIPULATIONS
Quote of the day: note that in this market company directors keep very low profiles?? 6 months ago they were flooding the market machine with intentions??
signs of the time?
Dowjones future forecast

ASX TAX SELLING ending soon Watch the bounce

well that a hard one ,, but get ready in case
we may have a surge?
technical speculator page
VIX reverse sharpely
TAX adjustements done??.Happy New Year?
2012 could be a slow start /pending DowJones correction?
the words are Correction.. recession ... and fears of Depression
MOST DIRECTORS ARE ROBBERS ON ASX
Dowjones in correction mode.>> next support?? correction = recession = depression ?? 3 support scenario possible?
Astute accounting taking place
link to cycles theory
WARNING SIGNALS GIVEN ON THE RISING FLAG (3 months periode)
Quote of the moment??
Buying time is upon us.... Everone is getting more and more fearful which leads me to think we are getting closer to this downturns bottom. I'll be buying more as funds free up.
USA DEBTS CEILING DEBATE? 2 august 2011
HOW WILL DOWJONES REACT????

Wednesday, January 12, 2011

BULL and BEAR CYCLES

 DowJones market update  as 17/06/2011


Dow Jones Rebounds 64 Points Amid Better Economic Numbers, 17-06-2011

Wall Street outlook: Dow Jones rebounds 64 points amid better economic numbers
Dow ended 64 pts higher at 11962 in a choppy session, as investors are veering between the debt crisis in Greece and U.S. economic data (i.e. lower weekly jobless claims and rising May housing starts) that offered some respite.

Sentiment also improved after the IMF vowed to continue to support Greece, and anticipating a “positive outcome“ at the next meeting of euro-zone leaders.

After the bell, Research In Motion reported weak 1Q results and slashed its full-year earnings forecast, signaling continued weakness in the company’s line of BlackBerry smartphones.

Daily Dow Jones Shows No Concrete Signs Of Sustainable Rebound
http://www.marketfutureoutlook.com/


 DowJones  market update 05/06/2011

 charts  readings :  top  of  wave 3 given at  12800   Flag  TOP first  support on  the monthly  chart  is 10200 a correction  was imminent : change of cycle= change of sentiment= all in the process??? see previous chart signals

in 2009  we saw a correction of  50 %  14000   to  7000?

a more conservative correction of 30 % would give us  correction 3840 =  9000 

then  we will be looking  for the support channel on the 20 years chart  beetween  8000 and 10000

all  economics indicators  are  very negative saying  the market need a purge  or correction?

so  for this time and keeping in mind USA  election cycle in 2012 we are waiting for the first target of <10200 to be achieved >

to be posted

1 year chart   6 waves  to top W6  = correction back to W2  W1  10200

5 year chart    6 waves down 6800 in 2009 + 6 waves up  to top 14000

                            T Ttheory  formation

                            support  W2   10000  - support W1  8500

20 year chart    6 cycles up correction to Cycle 1  = 8200 Cycle 2 = 10200

                            trend line projection   about  9000


click on images to enlarge

Dow 25 years chart   
 
The Weekly Report For June 6th - June 10th, 2011
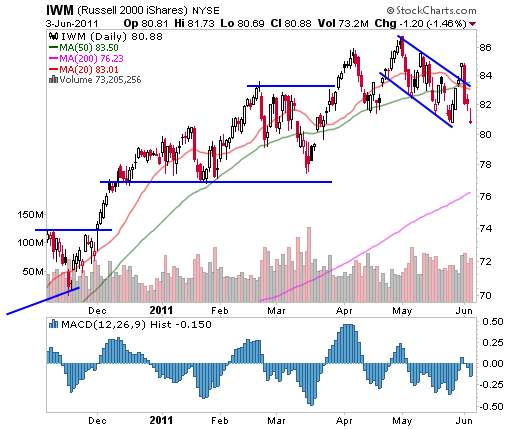
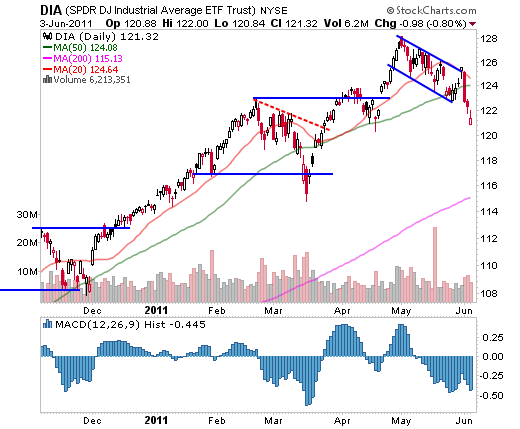
Commentary: The markets attempted a breakout Tuesday, following the long holiday weekend with a gap above the recent channel. After some intraday weakness, they recovered to close near their highs leaving market participants optimistic about a rally. However, things became unraveled Wednesday, as the markets reversed and wiped out all of last weeks gains in short order. While the market has not really confirmed a top, it continues to show weakness and each of the index ETF’s we follow are well below their 50-day moving averages and showing an increase in volume as they drop.  
The S&P500 as represented by the S&P 500 SPDRS (NYSE:SPY) sliced back through its 50-day moving average after reclaiming it last week. It didn’t find any buyers on this trip through the average and went on to make new lows. This puts the markets in a precarious position, as it is falling under the prior channel it was following, only days after attempting to clear it. The April lows are the level to watch in the coming days to see if SPY can attract buyers in that area. In either case, traders are likely better off simply waiting. Buying the dip is dangerous at this point, and shorting after the sharp move lower is too risky as well. (For more, see Support & Resistance Basics)
The Diamonds Trust, Series 1 (NYSE:DIA) ETF also reversed after attempting to clear its recent channel and actually is well beneath the channel now. Much like SPY, the April lows are worth keeping an eye on to see how it reacts to what should be support. However, even if DIA finds support, it will likely take some time to repair this week’s damage.

The iShares Russell 2000 Index (NYSE:IWM) ETF is in a similar position to QQQ. It finished the week pretty close to last weeks lows after a very weak Friday. However, IWM is in a clear pattern of lower highs and is also well beneath its 20 and 50-day moving averages. Much like with the other indexes, traders are likely better served waiting patiently for the markets to stabilize.
 Bottom Line
While the markets have been sending mixed signals recently, there was no mistaking this week’s action. The markets reversed sharply after a weak breakout attempt and are back to multi week lows. They are also mired under their 20 and 50-day moving averages after falling on increased volume. The market certainly appears to be topping out as we head into the summer trading season, although I hesitate to say it due to the weekly chart still showing an uptrend. In either case, what is important for traders is to realize that the environment is fraught with risk right now. There are times when it is better to reduce exposure to the markets and wait patiently for the markets to give you an opportunity. This is likely one of those times. If you are still holding several positions, make sure it is because you have a specific plan you are following and not because you are stuck and unwilling to take a loss. If the markets have a full fledged correction, its possible that much lower prices can be seen fairly quickly. Next week will surely shed more light on where we stand.


as  a reminder  i did upload  the  general cycle chart
and  the long term projections


Bull or Bear Markets

Are we in a bull or bear market? Good question. Many investors use these terms, yet few have a clear idea of how to identify a bull or a bear market. If you know the difference then you will be one of the first to profit.

Market Trend

"The trend is your friend" is one of those Wall Street axioms that make sense to follow. After all, the trend of the overall market determines approximately 60% of the performance of a stock. In fact, the market trend is the most important factor to consider in your investing analysis. Accurately gauging the market is not a matter of luck. The transition from a bear to a bull market creates many of the best investing opportunities. Fortunately, there are telltale indicators that can help you identify bull and bear markets.
What do you look for to identify a change in the trend of the market? First, it is best to keep the method simple. Second, the market tends to anticipate changes in the economy by up to six months. Therefore, we cannot look to the economy to get our warning signs. Fortunately, there are ways to interpret the psychological behavior of the market using several proven technical analysis indicators.
The chart below displays the S&P 500 index for the last 20 years. Professional traders and investors use the S&P 500, as it is a much better representation of the stock market than the DJIA, which is what the talking heads on TV quote.
Starting at the top of the chart, the RSI or Relative Strength Indicator signals a transition from a bull to a bear market when it falls through 50. When the RSI crosses up through 50, it signals a bull market is underway.
The RSI compares the magnitude of a stock's recent gains to the magnitude of its recent losses and turns that information into a number that ranges from 0 to 100. When the sizes of gains outnumber losses, it moves up. Should the size of losses outnumber the size of gains, it falls. The idea is to measure the underlying strength of the market. If there are more days moving up and the size of the move up is larger than the size of the move down, the market is moving up and so is the indicator. The same holds when moving down. As a result, the RSI tells you whether more investors are buying. When it turns down through 50, it is telling you that there are fewer buyers, indicating the market is more likely to go down.
Notice the horizontal blue line at the market top in 2000 and again in 2007. Often highs like the one in 2007 offer resistance to a market that is moving up. Investors who owned shares of stock at a former high tend to sell those shares when they finally reach the high again, seeking to get out with their money. This selling pressure overcomes the buying volume and the market turns down. When this takes place, it is another sign the market is turning from a bull to a bear market.
The 24-month Exponential Moving Average (EMA) offers a good indication of the transition from a bull to a bear market and back to a bull again. When the S&P 500 falls through the 24-month EMA, it is a sign that the up trend is reversing. When the market is above a moving average, it tells you that there is more demand for stock. On the other hand when the market is below the moving average, it indicates that there is less demand for stock. This change in demand for stock is a major force in driving the market up and down. Knowing when this change takes place helps to define when we observe the transition from a bull to a bear market and back again.
Often a trend line forms that defines the direction of a stock or the market. On the chart below, an up trend began more than 25 years ago. In the recent bear market, this trend was tested as the market fell precipitously. However, it held  and the market rebounded. In this case, the trend line does not describe a bull or bear market. Rather it tells us that there was a good chance that buying volume would overcome the selling volume and the market would stop going down.
Going further down on the chart, we come to the MACD or Moving Average Convergence Divergence indicator. When the MACD turns down through the 9 month moving average it is sign the S&P 500 is about to turn down. On the other hand, when the MACD rises through the 9-month average, it is a sign the S&P 500 is turning from a bear to a bull market. Our article on the MACD Indicator provides more information on this useful technical guide.
At the bottom of the chart, we find the Slow Stochastic, another indicator useful to identify bull or bear markets. For this indicator we use a 60 period %K factor. When the Slow Stochastic falls through 80, it is a sign of a bear market. The Slow Stochastic gives a buy sign, when it rises through the 20 level, it gives a sign a bull market is beginning. Our article on the Slow Stochastic provides more insight on how to use the Slow Stochastic Oscillator.
20 year month chart of S&P 500 showing bull and bear market indicators

Another Bull Bear Indicator

Since the chart above is a monthly chart, it can delay the signal of a new bear or bull market. Fortunately, there is a way that works with the daily chart to give you early warning that the bear market might be over. It turns out the 150-day Exponential Moving Average (EMA) provides a good way to identify that a new bull market has begun. When the 150-day EMA flattens and then turns up, it is a good signal that the bear market is over and a new bull market is beginning.
The chart below shows the end of the bear market in early 2004. Once in 2003 and again in early 2004, the market rallied and the 150 EMA flattened. In each case, the market turned back down. In addition, the 150-day EMA only flattened, as it did not turn up.
In April 2004, the 150-day EMA flattened and then turned up, signaling an end to the bear market and the beginning of a new bull market. This approach provides investors another way to logically identify the bear to bull market transition.
chart showing 150 day EMA as bull bear market indicator
Charts courtesy of Stockcharts.com
Investors who are on the right side of the trend will beat the market. The technical analysis offered provides a good way for investors to participate in the bull or bear market trends. Once you can identify the bull or bear market trend, you can then invest with confidence that the market is on your side.
I also encourage you to read Market Cycles, as it describes the major cycles the market tends to experience. By the way we use these technical indicators for many of our analysis of the market indexes, stocks, and Exchange Traded Funds (ETFs).

VIX  CHART 

Healthy VIX levels ... for now.
Today's chart show's the Volatility Index (VIX) and its action back to January 2010.
Note what has happened to the VIX since May of 2010.   After reaching a peak level last May, its has continuously made lower/highs and lower/lows ... the definition of a down trend.  
Since the VIX moves opposite to the stock market, this has been a bullish sign.  Currently, the VIX is below a level of 20, and below fan line number 5 which is currently a positive bias condition.
Now, take a moment and look far to the right where you can see the three trend lines converging on each other.    A critical, apex intersection will occur before the end of February.   Why is that important?
Because that is where the odds are very high for a pattern breakout ... and that could happen in the next few weeks, or next month.    When it happens, the odds are for an upside breakout on the VIX which would be a negative for the market at that time ... so start putting the VIX on your radar if you haven't done so already.

*** Feel free to share this page with others by using the "Send this Page to a Friend" link below.


WWW.TTHEORY.COM


visit for a chart on SPP forecast


No comments:

Post a Comment

Note: Only a member of this blog may post a comment.