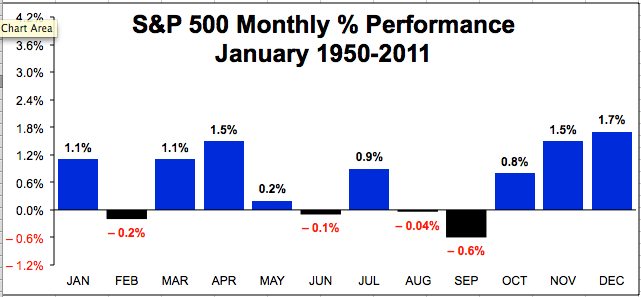
now we are in the correction mode..
the first sell off is happening now
the mont of june is approaching
lots of cross accounting to be done
ELLIOT WAVES THEORY
Home > Stocks
12,400 -- An Important Level the Dow Hasn't Broken
Will the Trend Channel Continue to Provide Resistance?
 | ||
| By Susan C. Walker Tue, 15 Mar 2011 17:15:00 ET | ||
 | ||

Did the bull market end on May 3?
That was when the Dow Jones Industrial Average closed at 12807.51 — which, at least so far, is the Dow's closing high for the rally that began in March 2009.
Contrarian analysis can't rule out that possibility. In fact, the behavior of various sentiment indexes in recent months is disturbingly similar to what has happened on the occasion of prior bull-market tops.
At least that is what I found after analyzing four different sentiment measures. I looked at the Investors Intelligence weekly survey of newsletter sentiment, data for which extended back to 1963. Specifically, I focused on the ratio of bullish advisors in this survey to the total of those who are either bullish or bearish.
I also analyzed the sentiment index maintained by Hulbert Financial Digest (HFD). It represents the average recommended equity exposure among a subset of short-term stock-market timers who are monitored by the HFD.
I sifted through the American Association of Individual Investors sentiment survey. As in the case of Investors Intelligence, I focused on the ratio of bullish responses in the AAII survey to the total of those who reported that they are either bullish or bearish.
Finally, I focused on the Chicago Board Options Exchange's Market Volatility Index, or VIX.
I analyzed how each of these four sentiment indicators behaved on the occasion of past bull-market tops, using the precise definition employed by Ned Davis Research, the institutional research firm. I found that sentiment is remarkably correlated with the stock market.
In fact, in nearly half the cases studied, bullish sentiment peaked at almost the same time as the market -- within fewer than five trading sessions before or after. It rarely has peaked more than a month or two before or after the top.
Because of this close correlation, sentiment can be used as a reality check on whether a market top has indeed been registered. If more than a few months separate the peak in sentiment and the date of the closing high up until that point, for example, chances are that the final top has not been seen. Another sign that the top has not yet been registered: Sentiment has peaked at much lower levels than those that prevailed at prior tops.
Unfortunately, on both grounds it's hard to rule out the suspicion that the May 3 top could be the end of the bull market.
According to the Investors Intelligence data, sentiment peaked on April 5, 28 days prior to the exact day of the May 3 high. On April 5, the ratio of bullish advisors to those who were either bullish or bearish came in at 78.5%, higher than the average level of 76.2% that stood on the occasion of prior bull-market tops.
According to the HFD survey, sentiment peaked on May 3, the very day of the market's top. The average exposure level then stood at 67.2%, versus an average of 79.6% from prior market tops. According to the AAII survey, sentiment peaked on Dec. 23 of last year, or more than four months prior to May 3. The ratio of bullish responses in the Dec. 23 survey to those indicating that they were either bullish or bearish stood at 79.4%, higher than the 78.7% average from prior tops. According to the VIX, investor optimism reached its apogee on April 28, five days prior to the day of the top. The VIX on April 28 closed at 14.62, which is less than the 15.51 average from prior bull-market tops.
Notice that the extreme levels of investor optimism recently reported by the various sentiment indexes are, in three out of the four cases studied, actually higher than the averages seen at prior bull-market tops. Notice also that, in three out of the four cases, the sentiment peak came within only a few days of the market's top.
Can contrarian-oriented traders, nevertheless, find comfort in the equity fund flow data? You may recall that those flows provided one of the strongest contrarian-based supports for this bull market in 2009 and 2010, as mutual-fund investors in both of those years pulled more money out of domestic equity funds and exchange-traded funds than they put back in.
This year, however, the situation has changed. TrimTabs Investment Research estimates that, following net outflows of $46.9 billion and $51.9 billion in 2009 and 2010, respectively, this year (through June 8) there has been a net inflow totaling $28.8 billion. So we no longer have the strong wall of worry that the bull market last year was able to climb.
To be sure, this year's inflows are not as large as those seen at prior bull-market tops. So the flow data are not, in themselves, sending any contrarian-based alarm bells. But, by the same token, those data no longer are providing the strongly bullish foundation that they were in each of the past two years.
The bottom line? The sentiment data no longer provide strong contrarian support for a bull market. And a number of the sentiment indexes are, or very close to, flashing outright sell signals.
___
Popular Stories on Yahoo!:


 go the dragon


 c
c

No comments:
Post a Comment
Note: Only a member of this blog may post a comment.