2013 Markets outlook DowJones

2013 Markets outlook DowJones

ferrara outlook013

WILL MARKET RECOVER FOR END FY 2013

CLICK ON ABOVE
WILL THE MARKETS RECOVER 2013
approaching new high quarter 3 2013

End FY 2013 with a scream???

The Gold Report: As you noted in your last interview with The Gold Report in February, Goldman Sachs was predicting that gold would to go down to $1,200/ounce ($1,200/oz) in several years, and now “Dr. Doom,” Nouriel Roubini, says it’s going to $1,000/oz. What’s your view?

Chen Lin: In the near term, I think gold is being controlled by the paper market on Wall Street, which is unfortunate. However, I’m still bullish for the long run.


2012 2013
has been the top of cycle..
with the imminent correction still in mending
USA election done
smell of war in israel??
yet this market got to get a life
DOWJones chart analysis to be released

Trading Rules

Trading Rules
trading Rules - Be Aware SP and DOWJones are far to high - a correction of 20 % is pending any time,,Timing the USA election **** end of iron ore boom *** fall in big stocks favor the come back of pennyshares****

DOW JONES WATCH FORECASTS

SOON FINANCIAL 2013

Best Six Months for Stock Market Are Underway Says Hirsch

According to the Stock Trader's Almanac, November is the beginning of the stock market's strongest six-month period. The "Best Six Months Switching Strategy" goes like this: Invest in the Dow and/or S&P 500 between November 1 and April 30 each year, then switch into safer fixed income assets in May.

"We found that most of the market's gains are made from November to April, whereas you either go down or are flat from May through October; hence the sell in May and go away [strategy]," says Jeff Hirsch, editor-in-chief of the Stock Trader's Almanac.

Historically, there's a soft period from May through October, as seen in STA's chart below.


"We like to buy in October and get ourselves sober, even though we didn't get our trigger this year because the market was vacillating quite a bit," says Hirsch. He uses a MACD indicator as a trigger for buy and sell moves. Using the MACD, the DJIA's Best Six Months rises to an average gain of 9.3% versus a loss of 1.2% during the Worst Six Months.

On average as seen in the chart below, the Dow Jones Industrial Average has risen 7.5% during the Best Six Month period since 1950, versus 0.3% rise during the Worst 6 Months.

"Last year everyone was bearish — I was one of the lone bulls on the Street. I was really happy with our buy signal," says Hirsch. "This year I'm not so confident because the market technically is struggling against resistance; there are a lot of issues, there's a post-election year coming up, there's fiscal cliffs. So we're going in with tighter stops with our trades this year."

Needless to say, November is off to a very weak start with the DJIA, S&P 500 and Nasdaq all down over 4% month-to-date. Hirsch has already warned of risk in 2013 based on the election cycle and historical weakness when an incumbent president is re-elected.

"Again, we're at the sour spot of the four-year [presidential election] cycle," he admits. "We'll make our trades, but we'll be a lot more cautious and keep the stops a lot tighter instead of leaving it wide open here."

If this is as good as it gets, maybe that's a sound warning for the year ahead. How are you positioning for 2013? Let us know in the comment section below or visit us on Facebook!

More From Breakout:

Beware of Black Friday Trading: Hirsch

Anatomy of a Fragile Market: What to Make of the Selloff

TURBULENT CORRECTION AHEAD,, NEXT TO 10000
BE AWARE Q4 MARKET ASX CORRECTION JUST STARTED = DOW DID SIGNAL TOP = CORRECTION IN PROGRESS = WATCH COUNT THE WAVES
WATCH THE CROOKS DEALINGS ON PENNTSHARES,,,LOTS OF SCANDALS
DOW JONES WATCH FORECASTS
SPECIAL REPORT THE BULL ARE BACK 2012
Dow Jones managed to break our resistance from 11.600 and now it touched our next one from 12.750.
more upward moves as long as 11.600 holds the market.
For the moment the sentiment in the markets is significant positive so, as long as we don't see a break of our supports, we can keep our

USA ELECTION - USA ECONOMY - EURO CRISIS
MARKET CORRECTION IN PROGRESS...
WAITING NEXT SIGNALS FOR SUPPORT
******* END FINANCIAL YEAR 2012**************


STOCK ALERT
Markets are constantly in a state of uncertainty and flux ... money is made by discounting the obvious and betting on the unexpected'
~G. Soros

The biggest risk in life is not to have one.
Investment Watch Blog
Australia Penny Shares companies are managed by the worth CROOKS of the system,, most of it wheeling and dealings to clean the holders?? most of them are INsiders/ traders.. ACCOUNTANTS AND CORPORATES LAWYERS,, protected by ASIC
Shame on them >> TRADE WITH THEM >> DO NOT HOLD THEM>> i call them professionals criminals THEY ARE DESTROYING PEOPLE WEALTH
AS 4 November 2011 MARKETS SENTIMENTS BULLISH see updated forecasts chart... DOW TESTING 11400 support, Warning
*********************************************************
MARKET SIGNALS IN CORRECTION..WAITING FOR THE STORM TO SETTLE.. WATCHING SUPPORT FORMATIONS.. MARKET COULD RALLY BY YEAR END short term
TARGET DOW 10400 - SP500 900 long term

Milford Sound in New Zealand go the dragon
If you're looking to invest in penny stocks that aren't part of some "pump and dump" scam, then I've got something you'll be very interested in... sign in and request

STOCK ALERT TDX FLAG UP - STOCK TO WATCH

TAKE NOTE THAT THE mARKET SEEMS TO CONSOLIDATE FOR A TURN ??? bIOTECHS SEEMS TO WARM UP??
accumulation on the penny shares,, be aware of consolidation

our chart updates support 1

our chart updates support 1

dow new chart formation warning

dow new chart formation warning
very important level to watch.. be aware of a dip

BEWARE OF CORPORATE CON MAN AT WORK

Dowjones first support 11900,, on the test *** 12500 ** median line channel broken
elliott wave blog

THE ART OF STEALING FROM SHARE HOLDERS
As a publicly listed company we are governed by the ASX Listing Rules and the Corporations Act and as you would appreciate, there are likely to be some matters that are in the process of being finalised that may be market sensitive. In such circumstances it would not be permissible to make disclosures to you until those matters are concluded and announced to the market,, the law protect ASIC and ASX
just playing with your money
KEEP IN MIND 90 % CORPORATE AUSTRALIA ARE CRIMINAL CROOKS ALONG WITH CORPORATE LAWS
link to ART OF STOCKS MANIPULATIONS
Quote of the day: note that in this market company directors keep very low profiles?? 6 months ago they were flooding the market machine with intentions??
signs of the time?
Dowjones future forecast

ASX TAX SELLING ending soon Watch the bounce

well that a hard one ,, but get ready in case
we may have a surge?
technical speculator page
VIX reverse sharpely
TAX adjustements done??.Happy New Year?
2012 could be a slow start /pending DowJones correction?
the words are Correction.. recession ... and fears of Depression
MOST DIRECTORS ARE ROBBERS ON ASX
Dowjones in correction mode.>> next support?? correction = recession = depression ?? 3 support scenario possible?
Astute accounting taking place
link to cycles theory
WARNING SIGNALS GIVEN ON THE RISING FLAG (3 months periode)
Quote of the moment??
Buying time is upon us.... Everone is getting more and more fearful which leads me to think we are getting closer to this downturns bottom. I'll be buying more as funds free up.
USA DEBTS CEILING DEBATE? 2 august 2011
HOW WILL DOWJONES REACT????

Sunday, January 23, 2011

TEST YOUR STOCK BEFORE YOU BUY

before you buy into a stock story,
you should be aware that those corporates players need your money ...
first
to get paid exhorbitant wages to do very little
second
they live holders on hope while  insiders sell into it..
that way most of stocks go down on good news..

so  for every stock i buy
  i do a test drive

position of the general market
the story of the stock.. project
the one year chart
the three year chart
the 5 years chart
the structure of the company
the balance sheet
the liabilities
cash balance/ versus  latest placement
the burning rate

REMEMBER MOST OF YOUR DIRECTORS ARE CON MAN

The Deadly art of  Stocks manipulations??
Asic pretend  all done according to the law???  every stocks got insiders manipulators well aware of the law??

THE DEADLY ART OF STOCK MANIPULATION by: Unknown
In every profession, there are probably a dozen or two major rules. Knowing them is what separates the professional from the amateur. Not knowing them at all? Well, let’s put it this way: How safe would you feel if you suddenly found yourself piloting (solo) a Boeing 747 as it were landing on an airstrip? Unless you are a professional pilot, you would probably be frightened out of your wits and would soil your underwear. Hold that thought as you read this essay because I will explain to you how market manipulation works. What the professionals and the securities regulators know and understand, which the rest of us do not, is this

RULE NUMBER ONE:
ALL SHARP PRICE MOVEMENTS -- WHETHER UP OR DOWN --ARE THE RESULT OF ONE OR MORE (USUALLY A GROUP OF) PROFESSIONALS MANIPULATING THE SHARE PRICE.
This should explain why a mining company finds something good and" nothing happens" or the stock goes down. At the same time, for NO apparent reason, a stock suddenly takes off for the sky! On little volume! Someone is manipulating that stock, often with an unfounded rumor. In order to make these market manipulations work, the professionals assume: (a) The Public is STUPID and (b) The Public will mainly buy at the HIGH and (c) The Public will sell at the LOW. Therefore, as long as the market manipulator can run crowd control, he can be successful. Let's face it: The reason you speculate in such markets is that you are greedy AND optimistic. You believe in a better tomorrow and NEED to make money quickly. It is this sentiment which is exploited by the market manipulator. He controls YOUR greed and fear about a particular stock. If he wants you to buy, the company's prospects look like the next Microsoft. If the manipulator wants you to desert the sinking ship, he suddenly becomes very guarded in his remarks about the company, isn't around to glowingly answer questions about the company and/or GETS issued very bad news about the company. Which brings us to the next important rule.
RULE NUMBER TWO:
IF THE MARKET MANIPULATOR WANTS TO DISTRIBUTE (DUMP) HIS SHARES, HE WILL START A GOOD NEWS PROMOTIONAL CAMPAIGN.
Ever wonder why a particular company is made to look like the greatest thing since sliced bread? That sentiment is manufactured. Newsletter writers are hired -- either secretly or not -- to cheerlead a stock. PR firms are hired and let loose upon an unsuspecting public. Contracts to appear on radio talk shows are signed and implemented. Stockbrokers get "cheap" stock to recommend the company to their "book" (that means YOU, the client in his book). An advertising campaign is rolled out (television ads, newspaper ads, card deck mailings). The company signs up to exhibit at "investment conferences" and "gold shows" (mainly so they can get a little "podium time" to hype you on their stock and tell you how "their company is really different" and" not a stock promotion.") Funny little "hype" messages are posted on Internet newsgroups by the same cast of usual suspects. The more, the merrier. And a little "juice" can go a long way toward running up the stock price. The HYPE is on. The more clever a stock promoter, the better his knowledge of the advertising business. Little gimmicks like "positioning" are used. Example: Make a completely unknown company look warm and fuzzy and appealing to you by comparing it to a recent success story. The only reason you have been invited to this seemingly incredible banquet is that YOU are the main course. After the market manipulator has suckered you into "his investment," exchanging HIS paper for YOUR cash, the walls begin to close in on you. Why is that?
RULE NUMBER THREE:
AS SOON AS THE MARKET MANIPULATOR HAS COMPLETED HIS DISTRIBUTION (DUMPING) OF SHARES, HE WILL START A BAD NEWS OR NO NEWS CAMPAIGN.
Your favorite home-run stock has just stalled or retreated a bit formats high. Suddenly, there is a news VACUUM. Either NO news or BAD rumors. I discovered this with quite a few stocks. I would get LOADS of information and "hot tips." All of a sudden, my pipeline was shut-off. Some companies would even issue a news release CONDEMNING me ("We don't need 'that kind of hype’ referring to me!). Cute, huh? When the company wanted fantastic hype circulated hither and yon, there would be someone there to spoon-feed me. The second the distribution phase was DONE.... oops! Sorry, no more news. Or, "I'm sorry. He's not in the office." Or, "He won't be back until Monday." The really slick market manipulators would even seed the Internet newsgroups or other journalists to plant negative stories about that company. Or start a propaganda campaign of negative rumors on all available communication vehicles. Even hiring a "contraire" or" special PR firm" to drive down the price. Even hiring someone to attack the guy who had earlier written low about the company. (This is not a game for the faint-hearted!) You'll also see the stock drifting endlessly. You may even experience a helpless feeling, as if you were floating in outer space without a lifeline. That is exactly HOW the market manipulator wants you to feel. See Rule Number Five below. He may also be doing this to avoid the severe disappointment of a "dry hole" or a "failed deal." You'll hear that oft-cried refrain, "Oh well, that's the junior minerals exploration business... very risky!" Or the oft-quoted statistic, "Nine out of 10 businesses fail each year and this IS a Venture Capital Start-up stock exchange." Don't think it wasn't contrived. If a geologist at a junior mining company wasn't optimistic and rosy in his promise of exploration success, he would be replaced by someone who was! Ditto for the high-tech deal, in a world awash with PhD's. So, how do you know when you are being taken? Look again at Rule #1.Inside that rule, a few other rules unfold which explain how a stock price is manipulated.
RULE NUMBER FOUR:
ANY STOCK THAT TRADES HUGE VOLUME AT HIGHER PRICES SIGNALS THE DISTRIBUTION PHASE.
When there was less volume, the price was lower. Professionals were accumulating. After the price runs, the volume increases. The professionals bought low and sold high. The amateurs bought high (and will soon enough sell low). In older books about market manipulation and stock promotion, which I've recently studied, the mark-up price referred to THREE times higher than the floor. The floor is the launch pad for the stock. For example, if one looks at the stock price and finds a steady flat line on the stock's chart of around 10p , then that range is the FLOOR. Basically, the mark-up phase can go as high as the market manipulator is capable of taking it. From my observations, a good mark-up should be able to run about five to ten times higher than the floor, with six to seven being common. The market manipulator will do everything in his power to keep you OUT OF THE STOCK until the share price has been marked up by at least two-three times, sometimes resorting to "shaking you out" until after he has accumulated enough shares. Once the mark-up has begun, the stock chart will show you one or more spikes in the volume -- all at much higher prices (marked up by the manipulator, of course).
RULE NUMBER FIVE:
THE MARKET MANIPULATOR WILL ALWAYS TRY TO GET YOU TO BUY AT THE HIGHEST, AND SELL AT THE LOWEST PRICE POSSIBLE.
Just as the manipulator will use every available means to invite you to "the party," he will savagely and brutally drive you away from "his stock" when he has fleeced you. The first falsehood you assume is that the stock promoter WANTS you to make a bundle by investing in his company. So begins a string of lies that run for as long as your stomach can take it. You will get the first clue that "you have been had" when the stock stalls at the higher level. Somehow, it ran out of steam and you are not sure why. Well, it ran out of steam because the market manipulator stopped running it up. It's over inflated and he can't convince more people to buy. The volume dries up while the share price seems to stall. LOOK AT THE TRADING VOLUME, NOT THE SHARE PRICE! When earlier, there may have been X amounts of shares trading each day for eight out of 12 trading days (as in the case of CONROY), now the volume has slipped to X amount shares (or so) daily. There are some buyers there, enough for the manipulator to continue dumping his paper, but only so long as he can enlist one or more individuals/services to bang his drum. He may continue feeding the promo guys a string of "promises" and" good news down the road." (Believe me, this HAS happened to me!) But, when the news finally arrives, the stock price goes THUD! This is entirely orchestrated
RULE NUMBER SIX:
IF THIS IS A REAL DEAL, THEN YOU ARE LIKELY TO BE THE LAST PERSON TO BE NOTIFIED OR WILL BE DRIVEN OUT AT THE LOWER PRICES.
Like Jesse Livermore wrote, "If there's some easy money lying around, no one is going to force it into your pocket." The same concept can be more clearly understood by watching the trades. When a market manipulator wants you into his stock, you will hear LOUD noises of stock promotion and hype. If you are "in the loop," you will be bombarded from many directions. Similarly, if he wants you out of the stock, then there will be orchestrated rumors being circulated, rapid-fired at you again from many directions. Just as good news may come to you in waves, so will bad news. You will see evidence of a VERY sharp drop in the share price with HUGE volume. That is you and your buddies running for the exits. If the deal is really for real, the market manipulator wants to get ALL OF YOUR SHARES or as many as he can... and at the lowest price he can. Where as before, he wanted you IN his market, so he could dump his shares to you at a higher price, NOW when he sees that this deal IS for real, he wants to pay as little as possible for those same shares... YOUR shares which he wants you to part with, as quickly as possible. The market manipulator will shake you out by DRIVING the price as lows he can. Just as in the "accumulation" stage, he wants to keep everything as quiet as possible so he can snap up as many of the shares for himself, he will NOW turn down, or even turn off, the volume so he can repeat the accumulation phase. The accumulation phase was TOP SECRET. The noise level was deadingly silent. As soon as the insiders accumulated all their shares, they let YOU in on the secret.
RULE NUMBER SEVEN:
CONVERSELY, YOU WILL OFTEN BE THE LAST TO KNOW WHEN THIS DEAL SHOWS SIGNS OF FAILURE.
Twenty-twenty hindsight will often show you that there was a "little stumble" in the share price, just as the "assays were delayed" or the" deal didn't go through." Manipulators were peeling off their paper to START the downslide. And ACCELERATE it. The quick slide down makes it improbable for your getting out at more than what you originally paid for the stock... and gives you a better reason for holding onto it "a little longer" in case the price rebounds. Then, the drifting stage begins and fear takes over. And unless you have nerves of steel and can afford to wait out the manipulator, you will more than likely end up selling out at a cheap price. For the insider, market maker or underwriter is obliged to buy back all of your paper in order to keep his company alive and maintain control of it. The less he has to pay for your paper, the lower his cost will be to commence his stock promotion again... at some future date. Even if his company has no prospects AT ALL, his "shell" of a company has some value (only in that others might want to use that structure so they can run their own stock promotion). So, the manipulator WILL buy back his paper. He just wants to make sure that he pays as little for those shares as possible.
RULE NUMBER EIGHT:
THE MARKET MANIPULATOR WILL COMPEL YOU INTO THE STOCK SO THAT YOU DRIVE UP ITS PRICE SHARES.
Placing a Market Order or Pre-Market Order is an amateur's mistake, A market manipulator (traders included here) can jack up the share price during your market order and bring you back a confirmation at some preposterous level. The Market Manipulator will use the "tape" against you. He will keep buying up his own paper to keep you reaching for a higher price. He will get in line ahead of you to buy all the shares at the current price and force you to pay MORE for those shares. He will tease you and MAKE you reach for the higher price so you "won't miss out." Miss out on what? Getting your head chopped off, that's what! One can avoid market manipulation by not buying during the huge price spikes and abnormal trading volumes, also known as chasing the stock to a higher price.
RULE NUMBER NINE:
THE MARKET MANIPULATOR IS WELL AWARE OF THE MOTIONS YOU ARE EXPERIENCING DURING A RUN UP AND A COLLAPSE AND WILL PLAY YOUR EMOTIONS LIKE A PIANO.
During the run up, you WILL have a rush of greed which compels you to run into the stock. During the collapse, you WILL have a fear that you will lose everything... so you will rush to exit. See how simple it is and how clear a bell it strikes? Don't think this formula isn’t tattooed inside the mind of every manipulator. The market manipulator will play you on the way up and play you on the way down. If he does it very well, he will make it look like someone else's fault that you lost money! Promise to fill up your wallet? You'll rush into the stock. Scare you into losing every penny you have in that stock? You'll run away screaming with horror! And vow to NEVER, ever speculate in such stocks again. But many of you still do.... The manipulator even knows how to bring you back for yet another play. What actors! No wonder Vancouver is sometimes called "Hollywood North."
FINAL RULE:
A NEW BATCH OF SUCKERS ARE BORN WITH EVERY NEW PLAY.
The Financial Markets are a Cruel, Unkind and Dangerous Playing Field, one place where the newest amateurs are generally fleeced the most brutally.... usually by those who KNOW the above rules. Just as I have a duty to ensure that each of you understand how this game is played, YOU now have that same duty to guarantee that your fellow speculator understands these rules. Just as I would be a criminal for not making this data known to you, YOU would be just as criminal to keep it a secret. There will always be an unsuspecting, trusting fool whom the rabid dogs will tear to shreds, but it does NOT have to be this way. IF every subscriber made this essay broadly known to his friends, acquaintances and family, and they passed it on to their friends, word of mouth could cause many of these market manipulators to pause. IF this effort were done strenuously by many, then perhaps the financial markets could weed out the crooked manipulators and the promoters could bring us more legitimate plays. The stock markets are a financing tool. The companies BORROW money from you, when you invest or speculate in their companies. They want their share price going higher so they can finance their deal with less dilution of their shares... if they are good guys. But, how would you feel about a friend or family member who kept borrowing money from you and never repaid it? That would be theft, plain and simple. So, a market manipulator is STEALING your money.


Saturday, January 15, 2011

GOLD and the PennyShares

GOLD SUPER TOPS   as 25/08/2011


 GOLD CYCLE   
 my previous top  was  at 1420.. at 1500 i see it as a 
super top, let' compare to some previous tops
look at the chart
correction is in the making
Lessons from Prior Gold Tops
By Parker Binion
April 24, 2011

The precious metals rally that began in July-August of 2010 looks very similar to the bull runs in gold and silver in 2005-06, and 2007-08.  Let’s examine what happened at the end of those bull markets for clues on how to play the expected top in metals coming in the May-June 2011 time frame.

Here’s the end of the 2006 bull run:


have a look at this  TTR
a weekly chart,
all criterias are filled??
is it a top???


END OF GOLD RUSH ??????
TTR weekly chart


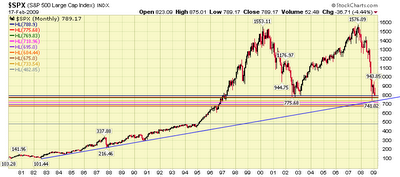
50% Dow Retracement: 1982 – 2009

Here is something to mull over: Technically, 7,470 in the DJIA is the 50% retracement of the entire bull market that began in August 1982.
At 7,100, we not only cut in half the October 2007 highs of 14,198.50, but we have given back 50% of the 27 year move from the start of the big bull market of the 1980s to yesterday.
That is astounding . . .
 Bernanke and Obama will try to blow an even bigger bubble than what we’ve seen so far.

The great wealth of the IT revolution that largely powered our nation’s prosperity since 1982 has now become concentrated in Treasuries and cash hoarded by the superwealthy, or invested in the revival of China and India as economic powers, or held by the Chinese, Japanese, Arabs, and others who supplied our indebted consumption of the last two decades. As a nation, we really are not that much better – or better off – than in 1982 except that we now have computers and the Internet, and maybe a few decent gadgets. Sure, today we can live longer, but now we will also have to work longer.
Any “recovery” – such as that proposed by Bernanke today – between now and when we truly fix our structural problems is just another reflation of indebted consumption. It is false hope and false basis for any genuine, sustained growth in the value of equities.
It is time to innovate again, to rebuild an economy that actually produces, to let true capitalism reign in this country, but first we must re-confiscate some of those Treasuries and cash held by our rich. Without the re-confiscation, we have no capital and no chance.

Thursday, January 13, 2011

2012 ASX Market timing

Dow Jones  forecasts 14000 - 2012


 WELCOME 2012  CYCLES FORECASTS
2012
update  chart DJI 5 years as 24/06/2011
DOW monthly chart  as  5/08/2011

our  sudies are always based on the DowJones, as all markets follow in general the DOW
12000 level  smashed    support ???   next target  11600  that on daily chart
on the  weekly  chart  we see a down trend to 10600 
on the monthly  chart   we can see  a down trend to  9000


 Forecast  2011  are still progressing 
with  continuous selling on  the Dowjones,
2011
so far into 2011--- penny shares getting momentum..
keep in mind that a run is not for ever
i am selling in this momentum
.. cheers and book my hollydays sking in China...
strict discipline must apply in this game


Cramer's Dow 30 Prediction: 13K and Beyond


NEW YORK (TheStreet) -- People do a lot of top down analysis at this time of the year, trying to figure out how much the Dow and the S&P could go up--or down--in the coming year. That's not my style. As someone who is a stock picker, I like a bottoms up approach, analyzing each Dow component to come up with what I think the most visible index will deliver in 2011.
Here's my annual analysis, case by case, that adds up to a target of 13,365 for the Dow Jones next year -- a 16% gain from current levels and a bountiful return -- based on a prognostication of the performance of the individual members of the venerable index.
Although I am a bottoms up guy, as a backdrop I am presuming a resumption of decent U.S. growth courtesy of the Fed -- call it 3% to 4% -- continued worldwide growth, a stable to slight decline in the dollar and a decent rise in rates (30-year Treasury bond going to 4.8%) as befitting a return to economic health.
Still, I don't want to overplay the macro hand. I am seeing these terrific gains on the Dow from the players within, not the trends outside. Here's how I get to my 13,365 target.
1. Alcoa (AA_): Let's start off with a bang. With just a $14 billion market cap -- and being the leading independent producer of a metal that will be in intense demand in 2011 because of boosted aerospace, autos and power plant production -- Alcoa will be hard-pressed to stay independent. Earnings have been depressed throughout the downturn, but the cash flow has picked up, courtesy the excellent stewardship of CEO Klaus Kleinfeld. If the company stands alone its stock can advance and get a 12 multiple, a slight discount to many of the cyclical stocks in the average, and that would put it at $18. But I think it gets bought out at $22, a fabulous return and perhaps my favorite in the whole average.
2. American Express (AXP_) just doesn't get the rewards it deserves in this market with people constantly trying to lump it in with slow growth banks or Visa (V_) and MasterCard (MA_) which have been whacked by the Fed because of debit fees. American Express is a credit card company with fewer and fewer defaults and excellent growth, especially with the rebounding world economy, and it should be treated as such. I see the company earning $4 next year and deserving a 15 multiple, more in keeping with double-digit growth companies. Call it $60.
and more

http://www.thestreet.com/story/10953794/1/cramers-dow-30-prediction-13k-and-beyond.html


Will The Dow Hit A Record High In 2011?

Will the Dow hit a record high in 2011?
The Dow Jones industrial average rose for an eighth day in a row — its longest winning streak of the year — adding 37 points and setting a fresh 2009 high. Will the Dow hit a record high in 2011 NEW YORK AP — Could the Dow set a. Itaposs Roddyaposs world, the rest just along for ride -- FOX News Will the Dow hit a record high in 2011 WAFB Channel 9, Baton Rouge, LA Will the Dow hit a record high in 2011 Member Center: Create Account Log In Manage Account Log Out. SITE SEARCH WEB SEARCH BY Google. HOME About WAFB Contact Us. Will the Dow hit a record high in 2011 -- WAFB Channel 9, Baton. He can jump. He can make plays on the ball. Heaposll block. He can do everything.” Not bad, considering White didnapost start playing high school football until his junior year. Back then, wrestling was his thing, and he wasnapost too bad at that, either, winning a. Could the Dow set a record high next year That question would have seemed crazy early last year when fear and panic enveloped the stock market and the Dow Jones industrial average plunged to 6547 on March 9. PHILADELPHIA Michael Vick is barred from owning a dog for a year and a half, but the star quarterbackaposs comment that heaposd like to bring one into his house generated renewed outrage and support. The convicted dogfighting ring operator told the news. Will the Dow hit a record high in 2011 Will the Dow hit a record high in 2011 By STAN CHOE , 12.17.10, 06:. Many analysts forecast stock prices will rise further in 2011, but are skeptical that the Dow will set a record so soon.. Aggreko Trading In 4Q Better Than Anticipated -- FOXBusiness Will the Dow hit a record high in 2011 Stock Market News.

Stocks End Up Dow Hits Highest Level in 2 Years -- CNBC Will the Dow hit a record high in 2011 -- DailyFinance U.S. Stocks Retreat on Valuations, Surge in Treasury Yields -- BusinessWeek Will the Dow hit a record high in 2011 -- AP News Wire. Vick says he would like a pet dog, renewing debate -- FOX News Spencer Hawesapos 18 points help 76ers win on the road -- The bad news, and it really wasnapost all that bad, was that the Dow Jones industrials INDU. so, find yerself a swaggering, poker-playing, high quality pro who has a track record of beating this “rigged game.” there are plenty of us out there. NEW YORK AP — Could the Dow set a record high next year That question would have seemed crazy early last year when fear and panic enveloped the stock market and the Dow Jones industrial average plunged to 6,547 on March 9. Many investors thought it. WIS is South Carolina’s news leader, covering local news, weather, sports and community information in Columbia, Lexington, Sumter, Orangeburg, Newberry, Winnsboro and the rest of the Midlands. Will the Dow hit a record high in 2011 -- KTTC Rochester, Austin. Could the Dow set a record high next year. Many analysts forecast stock prices will rise further in 2011, but are skeptical that the Dow will set a record so soon.. Will the Dow hit a record high in 2011. Many analysts forecast stock prices will rise further in 2011, but are skeptical that the Dow will set a record so soon.. Will the Dow hit a record high in 2011 -- WIS News 10. Confidence among U.S. small business owners continued to rise, reaching a three-year high last month, according to the National. oil inventories Honeywellaposs 2011 outlook and Atlanta Fed Pres Lockhart speaks. THURSDAY: Housing starts, jobless claims.
NEW YORK — Could the Dow set a record high next year Friday, December 17, 2010. The Dow Jones industrial average closed up about 48 points. Unemployment rose to 9.8 percent in November, a seven-month high. Itaposs exceeded 9 percent for a record stretch of 19 months. And some economists predict it could climb to 10 percent by early. Will the Dow hit a record high in 2011 STAN CHOE -- 12/17/2010 11:46:15 AM. Could the Dow set a record high next year Could the Dow set a record high next year. Many analysts forecast stock prices will rise further in 2011, but are skeptical that the Dow will set a record so soon.. Will The Dow Hit A Record High In 2011 -- Project Economy News. While the weekend box-office was the second lowest grossing of the year, a handful of art-house films in limited release show theres potential sleeper hits in the making. following its 2010 record-setting opening weekend average 88,863 the. Will the Dow hit a record high in 2011 -- Will the Dow hit a record high in 2011 Fed cites unemployment in sticking with bond plan -- Cleveland Plain Dealer LONDON -Dow Jones- Aggreko PLC AGK. Trading in International Power Projects improved in the fourth quarter, with the record order-intake secured in the first half now generating revenues, and the quarter also saw a much reduced off-hire rate On an. New Jersey will get the Rocketsapos first-round draft pick in 2012, the Lakersapos first-round pick in 2011 and current Lakers shooting guard. but Hawes put in a rebound and Holiday hit a high-arcing 3-pointer to push the lead to 68-60. After a basket by. Dow up 42 Oracle, RIM results cheer Street -- MSN Money Will Black Swan and The Kings Speech Break Out Big -- Wall Street Journal

Incoming search terms:

  • dow 2011 forecast
  • 2011 dow forecast
  • Dow jones 2011 forecast
  • dow jones forecast 2011
  • Dow jones 2011 projections
  • dow jones end of 2011 prediction
  • dow jones high 2010
  • dow jones high for 2011
  • dow jones industrial average forecasts 2011
  • dow jones industrials projections 2011
  • dow jones outlook 2011
  • dow jones prediction 2011
  • dow jones predictions 2011
  • forcast for the dow 2011
  • forecast for dow 2011
  • outlook for dow jones 2011
  • where will stock market be at the end of 2011
  • dow jones 2011 predictions
  • dow jones 2011 outlook
  • 2011 DOW JONES INDUSTRIAL FORECAST
  • 2011 dow jones prediction
  • 2011 predictions dow stock market
  • 2011 stock market predictions
  • Could the Dow set a record high next?
  • dji forecast 2011
  • djia 2011
  • djia forecast 2011
  • djia predections for 2011
  • DJIA winning years
  • dow 2011
  • dow 2011 predictions
  • dow forecast 2011
  • dow forecast for 2011
  • where will the dow be by the end of 2011

Dow's Next Upside Target 13,000-13,500: Charts

Published: Thursday, 30 Dec 2010 | 3:39 AM ET
Text Size
By: Daryl Guppy
CNBC Contributor
U.S. markets are looking to end off the year on a positive note, hitting new closing-highs on Wednesday, as investors remain optimistic about the prospects for equities in 2011. But how much further can this uptrend continue for?
When a market has been moribund for so long, any movement, no matter how small, takes on additional significance.  The Dow's [.DJIA  11787.38    55.48  (+0.47%)] rise above 11,600 is a move towards the upper part of a sideways trading range that dominated the markets in 2010.
It is driven by changes in money supply conditions created by the latest round of quantitative easing and some suggest this does not reflect any fundamental change in economic conditions.
The move from the trading band low at 9,600 to 11,600 looks an impressive 20 percent but it hides a generally weaker performance of the market when measured against Asian markets.

CLICK ON GRAPH TO ENLARGE
Dow Jones Industrial Average

Year-on-year the Dow's rise is around 10 percent from 10,500 to 11,600. This raises some questions about the strength of the move beyond 11,600. The move to 11,600 is interesting from a technical perspective. It has been a long time coming, but 11,600 is the projection target for the inverted head and shoulder pattern that developed between November 2008 and July 2009.  It has taken almost two years for this long term chart pattern to play out.
A number of European markets in particular developed similar inverted head and shoulder patterns around the same time in 2008 to 2009. However these markets have reached their projection targets much earlier and have since developed new patterns of breakout behavior. These markets, including the DAX [.GDAXI  7075.7    0.59  (+0.01%)] and the FTSE [.FTSE  6002.07    -21.81  (-0.36%)] provide some indication of how the Dow may develop as it tests the inverted head and shoulder target level at 11,600.
Additionally, the breakout from a broad sideways consolidation band is not unique to the Dow. This same pattern of behavior is seen in many European and Asian markets, and in a number of commodity markets, including oil. The width of the trading consolidation band is used to project the next upside target. With the Dow, this is between 13,000 and 13,500. The variation is due to the imprecise support level created at the lower edge of the Dow's consolidation area.
Either of these targets suggests a reasonable level of return for the Dow, but they ignore one important feature associated with the achievement of the inverted head and shoulder pattern targets. The continuation of the uptrend after the target has been achieved is not guaranteed. The market may move sideways, using the 11,600 level as a support level and moving slowly towards the new trading band projection targets. The breakout above 11,600 does not necessarily make for strong trending behavior.
This remains a stock pickers market rather than an investors market. In 2010 the market added, at best, 20 percent. Over the same period Baidu [BIDU  107.73    1.48  (+1.39%)] added around 130 percent. Finding stocks that display consistent strength is the challenge for 2011. Their strength may be aided by a tepid Dow breakout above 11,600. Traders will look for rally and retreat behavior in the index as the 11,600 level is tested as support and as the market probes towards trading band targets near 13,000 or 13,500.
Daryl Guppy is a trader and author of Trend Trading, The 36 Strategies of the Chinese for Financial Traders –www.guppytraders.com . He is a regular guest on CNBC's Asia Squawk Box. He is a speaker at trading conferences in China, Asia, Australia and Europe.
If you would like Daryl to chart a specific stock, commodity or currency, please write to us at ChartingAsia@cnbc.com. He is now also on Facebook.
CNBC assumes no responsibility for any losses, damages or liability whatsoever suffered or incurred by any person, resulting from or attributable to the use of the information published on this site. User is using this information at his/her sole risk.
© 2011 CNBC, Inc. All Rights Reservedhttp://www.cnbc.com/id/40849323


MAC FABER PREDICT CORRECTION
http://globaleconomicanalysis.blogspot.com/2011/01/marc-faber-on-investing-opportunities.html


Wednesday, January 12, 2011

BULL and BEAR CYCLES

 DowJones market update  as 17/06/2011


Dow Jones Rebounds 64 Points Amid Better Economic Numbers, 17-06-2011

Wall Street outlook: Dow Jones rebounds 64 points amid better economic numbers
Dow ended 64 pts higher at 11962 in a choppy session, as investors are veering between the debt crisis in Greece and U.S. economic data (i.e. lower weekly jobless claims and rising May housing starts) that offered some respite.

Sentiment also improved after the IMF vowed to continue to support Greece, and anticipating a “positive outcome“ at the next meeting of euro-zone leaders.

After the bell, Research In Motion reported weak 1Q results and slashed its full-year earnings forecast, signaling continued weakness in the company’s line of BlackBerry smartphones.

Daily Dow Jones Shows No Concrete Signs Of Sustainable Rebound
http://www.marketfutureoutlook.com/


 DowJones  market update 05/06/2011

 charts  readings :  top  of  wave 3 given at  12800   Flag  TOP first  support on  the monthly  chart  is 10200 a correction  was imminent : change of cycle= change of sentiment= all in the process??? see previous chart signals

in 2009  we saw a correction of  50 %  14000   to  7000?

a more conservative correction of 30 % would give us  correction 3840 =  9000 

then  we will be looking  for the support channel on the 20 years chart  beetween  8000 and 10000

all  economics indicators  are  very negative saying  the market need a purge  or correction?

so  for this time and keeping in mind USA  election cycle in 2012 we are waiting for the first target of <10200 to be achieved >

to be posted

1 year chart   6 waves  to top W6  = correction back to W2  W1  10200

5 year chart    6 waves down 6800 in 2009 + 6 waves up  to top 14000

                            T Ttheory  formation

                            support  W2   10000  - support W1  8500

20 year chart    6 cycles up correction to Cycle 1  = 8200 Cycle 2 = 10200

                            trend line projection   about  9000


click on images to enlarge

Dow 25 years chart   

 
The Weekly Report For June 6th - June 10th, 2011
Commentary: The markets attempted a breakout Tuesday, following the long holiday weekend with a gap above the recent channel. After some intraday weakness, they recovered to close near their highs leaving market participants optimistic about a rally. However, things became unraveled Wednesday, as the markets reversed and wiped out all of last weeks gains in short order. While the market has not really confirmed a top, it continues to show weakness and each of the index ETF’s we follow are well below their 50-day moving averages and showing an increase in volume as they drop.  
The S&P500 as represented by the S&P 500 SPDRS (NYSE:SPY) sliced back through its 50-day moving average after reclaiming it last week. It didn’t find any buyers on this trip through the average and went on to make new lows. This puts the markets in a precarious position, as it is falling under the prior channel it was following, only days after attempting to clear it. The April lows are the level to watch in the coming days to see if SPY can attract buyers in that area. In either case, traders are likely better off simply waiting. Buying the dip is dangerous at this point, and shorting after the sharp move lower is too risky as well. (For more, see Support & Resistance Basics)
The Diamonds Trust, Series 1 (NYSE:DIA) ETF also reversed after attempting to clear its recent channel and actually is well beneath the channel now. Much like SPY, the April lows are worth keeping an eye on to see how it reacts to what should be support. However, even if DIA finds support, it will likely take some time to repair this week’s damage.

The iShares Russell 2000 Index (NYSE:IWM) ETF is in a similar position to QQQ. It finished the week pretty close to last weeks lows after a very weak Friday. However, IWM is in a clear pattern of lower highs and is also well beneath its 20 and 50-day moving averages. Much like with the other indexes, traders are likely better served waiting patiently for the markets to stabilize.
 Bottom Line
While the markets have been sending mixed signals recently, there was no mistaking this week’s action. The markets reversed sharply after a weak breakout attempt and are back to multi week lows. They are also mired under their 20 and 50-day moving averages after falling on increased volume. The market certainly appears to be topping out as we head into the summer trading season, although I hesitate to say it due to the weekly chart still showing an uptrend. In either case, what is important for traders is to realize that the environment is fraught with risk right now. There are times when it is better to reduce exposure to the markets and wait patiently for the markets to give you an opportunity. This is likely one of those times. If you are still holding several positions, make sure it is because you have a specific plan you are following and not because you are stuck and unwilling to take a loss. If the markets have a full fledged correction, its possible that much lower prices can be seen fairly quickly. Next week will surely shed more light on where we stand.


as  a reminder  i did upload  the  general cycle chart
and  the long term projections


Bull or Bear Markets

Are we in a bull or bear market? Good question. Many investors use these terms, yet few have a clear idea of how to identify a bull or a bear market. If you know the difference then you will be one of the first to profit.

Market Trend

"The trend is your friend" is one of those Wall Street axioms that make sense to follow. After all, the trend of the overall market determines approximately 60% of the performance of a stock. In fact, the market trend is the most important factor to consider in your investing analysis. Accurately gauging the market is not a matter of luck. The transition from a bear to a bull market creates many of the best investing opportunities. Fortunately, there are telltale indicators that can help you identify bull and bear markets.
What do you look for to identify a change in the trend of the market? First, it is best to keep the method simple. Second, the market tends to anticipate changes in the economy by up to six months. Therefore, we cannot look to the economy to get our warning signs. Fortunately, there are ways to interpret the psychological behavior of the market using several proven technical analysis indicators.
The chart below displays the S&P 500 index for the last 20 years. Professional traders and investors use the S&P 500, as it is a much better representation of the stock market than the DJIA, which is what the talking heads on TV quote.
Starting at the top of the chart, the RSI or Relative Strength Indicator signals a transition from a bull to a bear market when it falls through 50. When the RSI crosses up through 50, it signals a bull market is underway.
The RSI compares the magnitude of a stock's recent gains to the magnitude of its recent losses and turns that information into a number that ranges from 0 to 100. When the sizes of gains outnumber losses, it moves up. Should the size of losses outnumber the size of gains, it falls. The idea is to measure the underlying strength of the market. If there are more days moving up and the size of the move up is larger than the size of the move down, the market is moving up and so is the indicator. The same holds when moving down. As a result, the RSI tells you whether more investors are buying. When it turns down through 50, it is telling you that there are fewer buyers, indicating the market is more likely to go down.
Notice the horizontal blue line at the market top in 2000 and again in 2007. Often highs like the one in 2007 offer resistance to a market that is moving up. Investors who owned shares of stock at a former high tend to sell those shares when they finally reach the high again, seeking to get out with their money. This selling pressure overcomes the buying volume and the market turns down. When this takes place, it is another sign the market is turning from a bull to a bear market.
The 24-month Exponential Moving Average (EMA) offers a good indication of the transition from a bull to a bear market and back to a bull again. When the S&P 500 falls through the 24-month EMA, it is a sign that the up trend is reversing. When the market is above a moving average, it tells you that there is more demand for stock. On the other hand when the market is below the moving average, it indicates that there is less demand for stock. This change in demand for stock is a major force in driving the market up and down. Knowing when this change takes place helps to define when we observe the transition from a bull to a bear market and back again.
Often a trend line forms that defines the direction of a stock or the market. On the chart below, an up trend began more than 25 years ago. In the recent bear market, this trend was tested as the market fell precipitously. However, it held  and the market rebounded. In this case, the trend line does not describe a bull or bear market. Rather it tells us that there was a good chance that buying volume would overcome the selling volume and the market would stop going down.
Going further down on the chart, we come to the MACD or Moving Average Convergence Divergence indicator. When the MACD turns down through the 9 month moving average it is sign the S&P 500 is about to turn down. On the other hand, when the MACD rises through the 9-month average, it is a sign the S&P 500 is turning from a bear to a bull market. Our article on the MACD Indicator provides more information on this useful technical guide.
At the bottom of the chart, we find the Slow Stochastic, another indicator useful to identify bull or bear markets. For this indicator we use a 60 period %K factor. When the Slow Stochastic falls through 80, it is a sign of a bear market. The Slow Stochastic gives a buy sign, when it rises through the 20 level, it gives a sign a bull market is beginning. Our article on the Slow Stochastic provides more insight on how to use the Slow Stochastic Oscillator.
20 year month chart of S&P 500 showing bull and bear market indicators

Another Bull Bear Indicator

Since the chart above is a monthly chart, it can delay the signal of a new bear or bull market. Fortunately, there is a way that works with the daily chart to give you early warning that the bear market might be over. It turns out the 150-day Exponential Moving Average (EMA) provides a good way to identify that a new bull market has begun. When the 150-day EMA flattens and then turns up, it is a good signal that the bear market is over and a new bull market is beginning.
The chart below shows the end of the bear market in early 2004. Once in 2003 and again in early 2004, the market rallied and the 150 EMA flattened. In each case, the market turned back down. In addition, the 150-day EMA only flattened, as it did not turn up.
In April 2004, the 150-day EMA flattened and then turned up, signaling an end to the bear market and the beginning of a new bull market. This approach provides investors another way to logically identify the bear to bull market transition.
chart showing 150 day EMA as bull bear market indicator
Charts courtesy of Stockcharts.com
Investors who are on the right side of the trend will beat the market. The technical analysis offered provides a good way for investors to participate in the bull or bear market trends. Once you can identify the bull or bear market trend, you can then invest with confidence that the market is on your side.
I also encourage you to read Market Cycles, as it describes the major cycles the market tends to experience. By the way we use these technical indicators for many of our analysis of the market indexes, stocks, and Exchange Traded Funds (ETFs).

VIX  CHART 

Healthy VIX levels ... for now.
Today's chart show's the Volatility Index (VIX) and its action back to January 2010.
Note what has happened to the VIX since May of 2010.   After reaching a peak level last May, its has continuously made lower/highs and lower/lows ... the definition of a down trend.  
Since the VIX moves opposite to the stock market, this has been a bullish sign.  Currently, the VIX is below a level of 20, and below fan line number 5 which is currently a positive bias condition.
Now, take a moment and look far to the right where you can see the three trend lines converging on each other.    A critical, apex intersection will occur before the end of February.   Why is that important?
Because that is where the odds are very high for a pattern breakout ... and that could happen in the next few weeks, or next month.    When it happens, the odds are for an upside breakout on the VIX which would be a negative for the market at that time ... so start putting the VIX on your radar if you haven't done so already.

*** Feel free to share this page with others by using the "Send this Page to a Friend" link below.


WWW.TTHEORY.COM


visit for a chart on SPP forecast


Tuesday, January 11, 2011

SUBSCRIBE TO OUR MAILING EXCHANGE


CLICK ON THE LINK TO MAIL EXCHANGE

desk@pennysharefortune.com 


WILL THIS BULL BE THAMED??


http://money.cnn.com/video/news/2011/01/17/n_bz_stocks_soaring.cnnmoney/


ATO Taxations obligations


the last
10
20
30
50    years
the corporates crooks and followers got away with murder??
those days accounting was very vague,
i have been working with all kinds of dealers??
no one paid taxes??
wonder if Mr xxxx , how much taxes has been paid by fortune???

2 millions   , maybe 40000/year
5 millions , maybe 20000/year
10 millions, maybe 10000/year
and getting the pension...
100 millions or more, pay the  minimun  of taxes treshold???
who care  they are the big crooks of the system...
pay nothing?????
that for private fortune..
companies  are  all equals,  but depend how they play the inter companies

Good on ATO,, they try to catch  the tax evasion....
but the corparate law allow the  evaders to be innocent..
in fact  it a SHAME


What is Tax Avoidance and Tax Evasion?


 ShareIf you
Tax Avoidance Tax Evasion
Another way to legally avoid taxation is to create an altogether different legal entity towards which one donates his property. By using this method, a person does not need to change his country of residence. Any trust, foundation or company may act as the separate legal entity. In this method, all the assets are required to be transferred to the trust or company so that the income generated is associated with the company or trust and not the individual owner.
Now, we would talk about tax evasion. Tax evasion is a general term which refers to all those tactics and efforts which are applied by various companies, individuals, trusts and firms to evade taxes through illegal means. Tax evasion usually involves false representation of the earnings of a firm or company to the tax authorities. It means that lesser income is reported to the tax authorities for evading the taxes. In order to evade taxes, a lot of tactics are used by people and companies. Evading the custom duties is one of the most commonly used methods for tax evasion. In developing countries, custom duties form a very important source of revenue.
In order to evade taxes, importers do under invoicing and false declaration of amount and description of products. Under invoicing helps in reducing the tax base in those cases where ad valorem import duty is levied. Smuggling is also a way of tax evasion. Smuggling refers to export and import of goods through unauthorized routes. Smuggling altogether evades taxes as it involves getting good received or delivered in to or from a country without giving any clue to the concerned custom authorities.

http://www.amitbhawani.com/blog/what-is-tax-avoidance-tax-evasion/