2013 Markets outlook DowJones

2013 Markets outlook DowJones

ferrara outlook013

WILL MARKET RECOVER FOR END FY 2013

CLICK ON ABOVE
WILL THE MARKETS RECOVER 2013
approaching new high quarter 3 2013

End FY 2013 with a scream???

The Gold Report: As you noted in your last interview with The Gold Report in February, Goldman Sachs was predicting that gold would to go down to $1,200/ounce ($1,200/oz) in several years, and now “Dr. Doom,” Nouriel Roubini, says it’s going to $1,000/oz. What’s your view?

Chen Lin: In the near term, I think gold is being controlled by the paper market on Wall Street, which is unfortunate. However, I’m still bullish for the long run.


2012 2013
has been the top of cycle..
with the imminent correction still in mending
USA election done
smell of war in israel??
yet this market got to get a life
DOWJones chart analysis to be released

Trading Rules

Trading Rules
trading Rules - Be Aware SP and DOWJones are far to high - a correction of 20 % is pending any time,,Timing the USA election **** end of iron ore boom *** fall in big stocks favor the come back of pennyshares****

DOW JONES WATCH FORECASTS

SOON FINANCIAL 2013

Best Six Months for Stock Market Are Underway Says Hirsch

According to the Stock Trader's Almanac, November is the beginning of the stock market's strongest six-month period. The "Best Six Months Switching Strategy" goes like this: Invest in the Dow and/or S&P 500 between November 1 and April 30 each year, then switch into safer fixed income assets in May.

"We found that most of the market's gains are made from November to April, whereas you either go down or are flat from May through October; hence the sell in May and go away [strategy]," says Jeff Hirsch, editor-in-chief of the Stock Trader's Almanac.

Historically, there's a soft period from May through October, as seen in STA's chart below.


"We like to buy in October and get ourselves sober, even though we didn't get our trigger this year because the market was vacillating quite a bit," says Hirsch. He uses a MACD indicator as a trigger for buy and sell moves. Using the MACD, the DJIA's Best Six Months rises to an average gain of 9.3% versus a loss of 1.2% during the Worst Six Months.

On average as seen in the chart below, the Dow Jones Industrial Average has risen 7.5% during the Best Six Month period since 1950, versus 0.3% rise during the Worst 6 Months.

"Last year everyone was bearish — I was one of the lone bulls on the Street. I was really happy with our buy signal," says Hirsch. "This year I'm not so confident because the market technically is struggling against resistance; there are a lot of issues, there's a post-election year coming up, there's fiscal cliffs. So we're going in with tighter stops with our trades this year."

Needless to say, November is off to a very weak start with the DJIA, S&P 500 and Nasdaq all down over 4% month-to-date. Hirsch has already warned of risk in 2013 based on the election cycle and historical weakness when an incumbent president is re-elected.

"Again, we're at the sour spot of the four-year [presidential election] cycle," he admits. "We'll make our trades, but we'll be a lot more cautious and keep the stops a lot tighter instead of leaving it wide open here."

If this is as good as it gets, maybe that's a sound warning for the year ahead. How are you positioning for 2013? Let us know in the comment section below or visit us on Facebook!

More From Breakout:

Beware of Black Friday Trading: Hirsch

Anatomy of a Fragile Market: What to Make of the Selloff

TURBULENT CORRECTION AHEAD,, NEXT TO 10000
BE AWARE Q4 MARKET ASX CORRECTION JUST STARTED = DOW DID SIGNAL TOP = CORRECTION IN PROGRESS = WATCH COUNT THE WAVES
WATCH THE CROOKS DEALINGS ON PENNTSHARES,,,LOTS OF SCANDALS
DOW JONES WATCH FORECASTS
SPECIAL REPORT THE BULL ARE BACK 2012
Dow Jones managed to break our resistance from 11.600 and now it touched our next one from 12.750.
more upward moves as long as 11.600 holds the market.
For the moment the sentiment in the markets is significant positive so, as long as we don't see a break of our supports, we can keep our

USA ELECTION - USA ECONOMY - EURO CRISIS
MARKET CORRECTION IN PROGRESS...
WAITING NEXT SIGNALS FOR SUPPORT
******* END FINANCIAL YEAR 2012**************


STOCK ALERT
Markets are constantly in a state of uncertainty and flux ... money is made by discounting the obvious and betting on the unexpected'
~G. Soros

The biggest risk in life is not to have one.
Investment Watch Blog
Australia Penny Shares companies are managed by the worth CROOKS of the system,, most of it wheeling and dealings to clean the holders?? most of them are INsiders/ traders.. ACCOUNTANTS AND CORPORATES LAWYERS,, protected by ASIC
Shame on them >> TRADE WITH THEM >> DO NOT HOLD THEM>> i call them professionals criminals THEY ARE DESTROYING PEOPLE WEALTH
AS 4 November 2011 MARKETS SENTIMENTS BULLISH see updated forecasts chart... DOW TESTING 11400 support, Warning
*********************************************************
MARKET SIGNALS IN CORRECTION..WAITING FOR THE STORM TO SETTLE.. WATCHING SUPPORT FORMATIONS.. MARKET COULD RALLY BY YEAR END short term
TARGET DOW 10400 - SP500 900 long term

Milford Sound in New Zealand go the dragon
If you're looking to invest in penny stocks that aren't part of some "pump and dump" scam, then I've got something you'll be very interested in... sign in and request

STOCK ALERT TDX FLAG UP - STOCK TO WATCH

TAKE NOTE THAT THE mARKET SEEMS TO CONSOLIDATE FOR A TURN ??? bIOTECHS SEEMS TO WARM UP??
accumulation on the penny shares,, be aware of consolidation

our chart updates support 1

our chart updates support 1

dow new chart formation warning

dow new chart formation warning
very important level to watch.. be aware of a dip

BEWARE OF CORPORATE CON MAN AT WORK

Dowjones first support 11900,, on the test *** 12500 ** median line channel broken
elliott wave blog

THE ART OF STEALING FROM SHARE HOLDERS
As a publicly listed company we are governed by the ASX Listing Rules and the Corporations Act and as you would appreciate, there are likely to be some matters that are in the process of being finalised that may be market sensitive. In such circumstances it would not be permissible to make disclosures to you until those matters are concluded and announced to the market,, the law protect ASIC and ASX
just playing with your money
KEEP IN MIND 90 % CORPORATE AUSTRALIA ARE CRIMINAL CROOKS ALONG WITH CORPORATE LAWS
link to ART OF STOCKS MANIPULATIONS
Quote of the day: note that in this market company directors keep very low profiles?? 6 months ago they were flooding the market machine with intentions??
signs of the time?
Dowjones future forecast

ASX TAX SELLING ending soon Watch the bounce

well that a hard one ,, but get ready in case
we may have a surge?
technical speculator page
VIX reverse sharpely
TAX adjustements done??.Happy New Year?
2012 could be a slow start /pending DowJones correction?
the words are Correction.. recession ... and fears of Depression
MOST DIRECTORS ARE ROBBERS ON ASX
Dowjones in correction mode.>> next support?? correction = recession = depression ?? 3 support scenario possible?
Astute accounting taking place
link to cycles theory
WARNING SIGNALS GIVEN ON THE RISING FLAG (3 months periode)
Quote of the moment??
Buying time is upon us.... Everone is getting more and more fearful which leads me to think we are getting closer to this downturns bottom. I'll be buying more as funds free up.
USA DEBTS CEILING DEBATE? 2 august 2011
HOW WILL DOWJONES REACT????

Wednesday, January 12, 2011

BULL and BEAR CYCLES

 DowJones market update  as 17/06/2011


Dow Jones Rebounds 64 Points Amid Better Economic Numbers, 17-06-2011

Wall Street outlook: Dow Jones rebounds 64 points amid better economic numbers
Dow ended 64 pts higher at 11962 in a choppy session, as investors are veering between the debt crisis in Greece and U.S. economic data (i.e. lower weekly jobless claims and rising May housing starts) that offered some respite.

Sentiment also improved after the IMF vowed to continue to support Greece, and anticipating a “positive outcome“ at the next meeting of euro-zone leaders.

After the bell, Research In Motion reported weak 1Q results and slashed its full-year earnings forecast, signaling continued weakness in the company’s line of BlackBerry smartphones.

Daily Dow Jones Shows No Concrete Signs Of Sustainable Rebound
http://www.marketfutureoutlook.com/


 DowJones  market update 05/06/2011

 charts  readings :  top  of  wave 3 given at  12800   Flag  TOP first  support on  the monthly  chart  is 10200 a correction  was imminent : change of cycle= change of sentiment= all in the process??? see previous chart signals

in 2009  we saw a correction of  50 %  14000   to  7000?

a more conservative correction of 30 % would give us  correction 3840 =  9000 

then  we will be looking  for the support channel on the 20 years chart  beetween  8000 and 10000

all  economics indicators  are  very negative saying  the market need a purge  or correction?

so  for this time and keeping in mind USA  election cycle in 2012 we are waiting for the first target of <10200 to be achieved >

to be posted

1 year chart   6 waves  to top W6  = correction back to W2  W1  10200

5 year chart    6 waves down 6800 in 2009 + 6 waves up  to top 14000

                            T Ttheory  formation

                            support  W2   10000  - support W1  8500

20 year chart    6 cycles up correction to Cycle 1  = 8200 Cycle 2 = 10200

                            trend line projection   about  9000


click on images to enlarge

Dow 25 years chart   

 
The Weekly Report For June 6th - June 10th, 2011
Commentary: The markets attempted a breakout Tuesday, following the long holiday weekend with a gap above the recent channel. After some intraday weakness, they recovered to close near their highs leaving market participants optimistic about a rally. However, things became unraveled Wednesday, as the markets reversed and wiped out all of last weeks gains in short order. While the market has not really confirmed a top, it continues to show weakness and each of the index ETF’s we follow are well below their 50-day moving averages and showing an increase in volume as they drop.  
The S&P500 as represented by the S&P 500 SPDRS (NYSE:SPY) sliced back through its 50-day moving average after reclaiming it last week. It didn’t find any buyers on this trip through the average and went on to make new lows. This puts the markets in a precarious position, as it is falling under the prior channel it was following, only days after attempting to clear it. The April lows are the level to watch in the coming days to see if SPY can attract buyers in that area. In either case, traders are likely better off simply waiting. Buying the dip is dangerous at this point, and shorting after the sharp move lower is too risky as well. (For more, see Support & Resistance Basics)
The Diamonds Trust, Series 1 (NYSE:DIA) ETF also reversed after attempting to clear its recent channel and actually is well beneath the channel now. Much like SPY, the April lows are worth keeping an eye on to see how it reacts to what should be support. However, even if DIA finds support, it will likely take some time to repair this week’s damage.

The iShares Russell 2000 Index (NYSE:IWM) ETF is in a similar position to QQQ. It finished the week pretty close to last weeks lows after a very weak Friday. However, IWM is in a clear pattern of lower highs and is also well beneath its 20 and 50-day moving averages. Much like with the other indexes, traders are likely better served waiting patiently for the markets to stabilize.
 Bottom Line
While the markets have been sending mixed signals recently, there was no mistaking this week’s action. The markets reversed sharply after a weak breakout attempt and are back to multi week lows. They are also mired under their 20 and 50-day moving averages after falling on increased volume. The market certainly appears to be topping out as we head into the summer trading season, although I hesitate to say it due to the weekly chart still showing an uptrend. In either case, what is important for traders is to realize that the environment is fraught with risk right now. There are times when it is better to reduce exposure to the markets and wait patiently for the markets to give you an opportunity. This is likely one of those times. If you are still holding several positions, make sure it is because you have a specific plan you are following and not because you are stuck and unwilling to take a loss. If the markets have a full fledged correction, its possible that much lower prices can be seen fairly quickly. Next week will surely shed more light on where we stand.


as  a reminder  i did upload  the  general cycle chart
and  the long term projections


Bull or Bear Markets

Are we in a bull or bear market? Good question. Many investors use these terms, yet few have a clear idea of how to identify a bull or a bear market. If you know the difference then you will be one of the first to profit.

Market Trend

"The trend is your friend" is one of those Wall Street axioms that make sense to follow. After all, the trend of the overall market determines approximately 60% of the performance of a stock. In fact, the market trend is the most important factor to consider in your investing analysis. Accurately gauging the market is not a matter of luck. The transition from a bear to a bull market creates many of the best investing opportunities. Fortunately, there are telltale indicators that can help you identify bull and bear markets.
What do you look for to identify a change in the trend of the market? First, it is best to keep the method simple. Second, the market tends to anticipate changes in the economy by up to six months. Therefore, we cannot look to the economy to get our warning signs. Fortunately, there are ways to interpret the psychological behavior of the market using several proven technical analysis indicators.
The chart below displays the S&P 500 index for the last 20 years. Professional traders and investors use the S&P 500, as it is a much better representation of the stock market than the DJIA, which is what the talking heads on TV quote.
Starting at the top of the chart, the RSI or Relative Strength Indicator signals a transition from a bull to a bear market when it falls through 50. When the RSI crosses up through 50, it signals a bull market is underway.
The RSI compares the magnitude of a stock's recent gains to the magnitude of its recent losses and turns that information into a number that ranges from 0 to 100. When the sizes of gains outnumber losses, it moves up. Should the size of losses outnumber the size of gains, it falls. The idea is to measure the underlying strength of the market. If there are more days moving up and the size of the move up is larger than the size of the move down, the market is moving up and so is the indicator. The same holds when moving down. As a result, the RSI tells you whether more investors are buying. When it turns down through 50, it is telling you that there are fewer buyers, indicating the market is more likely to go down.
Notice the horizontal blue line at the market top in 2000 and again in 2007. Often highs like the one in 2007 offer resistance to a market that is moving up. Investors who owned shares of stock at a former high tend to sell those shares when they finally reach the high again, seeking to get out with their money. This selling pressure overcomes the buying volume and the market turns down. When this takes place, it is another sign the market is turning from a bull to a bear market.
The 24-month Exponential Moving Average (EMA) offers a good indication of the transition from a bull to a bear market and back to a bull again. When the S&P 500 falls through the 24-month EMA, it is a sign that the up trend is reversing. When the market is above a moving average, it tells you that there is more demand for stock. On the other hand when the market is below the moving average, it indicates that there is less demand for stock. This change in demand for stock is a major force in driving the market up and down. Knowing when this change takes place helps to define when we observe the transition from a bull to a bear market and back again.
Often a trend line forms that defines the direction of a stock or the market. On the chart below, an up trend began more than 25 years ago. In the recent bear market, this trend was tested as the market fell precipitously. However, it held  and the market rebounded. In this case, the trend line does not describe a bull or bear market. Rather it tells us that there was a good chance that buying volume would overcome the selling volume and the market would stop going down.
Going further down on the chart, we come to the MACD or Moving Average Convergence Divergence indicator. When the MACD turns down through the 9 month moving average it is sign the S&P 500 is about to turn down. On the other hand, when the MACD rises through the 9-month average, it is a sign the S&P 500 is turning from a bear to a bull market. Our article on the MACD Indicator provides more information on this useful technical guide.
At the bottom of the chart, we find the Slow Stochastic, another indicator useful to identify bull or bear markets. For this indicator we use a 60 period %K factor. When the Slow Stochastic falls through 80, it is a sign of a bear market. The Slow Stochastic gives a buy sign, when it rises through the 20 level, it gives a sign a bull market is beginning. Our article on the Slow Stochastic provides more insight on how to use the Slow Stochastic Oscillator.
20 year month chart of S&P 500 showing bull and bear market indicators

Another Bull Bear Indicator

Since the chart above is a monthly chart, it can delay the signal of a new bear or bull market. Fortunately, there is a way that works with the daily chart to give you early warning that the bear market might be over. It turns out the 150-day Exponential Moving Average (EMA) provides a good way to identify that a new bull market has begun. When the 150-day EMA flattens and then turns up, it is a good signal that the bear market is over and a new bull market is beginning.
The chart below shows the end of the bear market in early 2004. Once in 2003 and again in early 2004, the market rallied and the 150 EMA flattened. In each case, the market turned back down. In addition, the 150-day EMA only flattened, as it did not turn up.
In April 2004, the 150-day EMA flattened and then turned up, signaling an end to the bear market and the beginning of a new bull market. This approach provides investors another way to logically identify the bear to bull market transition.
chart showing 150 day EMA as bull bear market indicator
Charts courtesy of Stockcharts.com
Investors who are on the right side of the trend will beat the market. The technical analysis offered provides a good way for investors to participate in the bull or bear market trends. Once you can identify the bull or bear market trend, you can then invest with confidence that the market is on your side.
I also encourage you to read Market Cycles, as it describes the major cycles the market tends to experience. By the way we use these technical indicators for many of our analysis of the market indexes, stocks, and Exchange Traded Funds (ETFs).

VIX  CHART 

Healthy VIX levels ... for now.
Today's chart show's the Volatility Index (VIX) and its action back to January 2010.
Note what has happened to the VIX since May of 2010.   After reaching a peak level last May, its has continuously made lower/highs and lower/lows ... the definition of a down trend.  
Since the VIX moves opposite to the stock market, this has been a bullish sign.  Currently, the VIX is below a level of 20, and below fan line number 5 which is currently a positive bias condition.
Now, take a moment and look far to the right where you can see the three trend lines converging on each other.    A critical, apex intersection will occur before the end of February.   Why is that important?
Because that is where the odds are very high for a pattern breakout ... and that could happen in the next few weeks, or next month.    When it happens, the odds are for an upside breakout on the VIX which would be a negative for the market at that time ... so start putting the VIX on your radar if you haven't done so already.

*** Feel free to share this page with others by using the "Send this Page to a Friend" link below.


WWW.TTHEORY.COM


visit for a chart on SPP forecast


Tuesday, January 11, 2011

SUBSCRIBE TO OUR MAILING EXCHANGE


CLICK ON THE LINK TO MAIL EXCHANGE

desk@pennysharefortune.com 


WILL THIS BULL BE THAMED??


http://money.cnn.com/video/news/2011/01/17/n_bz_stocks_soaring.cnnmoney/


ATO Taxations obligations


the last
10
20
30
50    years
the corporates crooks and followers got away with murder??
those days accounting was very vague,
i have been working with all kinds of dealers??
no one paid taxes??
wonder if Mr xxxx , how much taxes has been paid by fortune???

2 millions   , maybe 40000/year
5 millions , maybe 20000/year
10 millions, maybe 10000/year
and getting the pension...
100 millions or more, pay the  minimun  of taxes treshold???
who care  they are the big crooks of the system...
pay nothing?????
that for private fortune..
companies  are  all equals,  but depend how they play the inter companies

Good on ATO,, they try to catch  the tax evasion....
but the corparate law allow the  evaders to be innocent..
in fact  it a SHAME


What is Tax Avoidance and Tax Evasion?


 ShareIf you
Tax Avoidance Tax Evasion
Another way to legally avoid taxation is to create an altogether different legal entity towards which one donates his property. By using this method, a person does not need to change his country of residence. Any trust, foundation or company may act as the separate legal entity. In this method, all the assets are required to be transferred to the trust or company so that the income generated is associated with the company or trust and not the individual owner.
Now, we would talk about tax evasion. Tax evasion is a general term which refers to all those tactics and efforts which are applied by various companies, individuals, trusts and firms to evade taxes through illegal means. Tax evasion usually involves false representation of the earnings of a firm or company to the tax authorities. It means that lesser income is reported to the tax authorities for evading the taxes. In order to evade taxes, a lot of tactics are used by people and companies. Evading the custom duties is one of the most commonly used methods for tax evasion. In developing countries, custom duties form a very important source of revenue.
In order to evade taxes, importers do under invoicing and false declaration of amount and description of products. Under invoicing helps in reducing the tax base in those cases where ad valorem import duty is levied. Smuggling is also a way of tax evasion. Smuggling refers to export and import of goods through unauthorized routes. Smuggling altogether evades taxes as it involves getting good received or delivered in to or from a country without giving any clue to the concerned custom authorities.

http://www.amitbhawani.com/blog/what-is-tax-avoidance-tax-evasion/

Thursday, January 6, 2011

OUR MISSION

awareness of corporates manipulations
awareness of Market cycles and trend
diligence of boards  managements
scrupulence of corporates laws
non chalance of ASIC

Monday, January 3, 2011

CHARTIST CORNER

our philosophy  is  we trade on chart patterns and waves..
when a stock has real fundamentals  the chart will be over taken
some example of ascending charts
YTC
SDL
HOG
PRR

TORO ENERGY  TOE
downtrend signals  watch
 

HAVE A LOOK AT RIO TINTO
a five  yearschart..
considering we are approaching a market top..
5  waves count    cycle 3
could be a reverse of trend???


another pattern example: PCL Pancontinental
criteria of Waves theory

THE DOGS ARE BARKING

good debut 2011
penny shares getting hoter???
my version  of dog/dingo =
bull and bear

Sunday, January 2, 2011

Muslims movements around the world

the wisdom of the Liberal abuse by the scams of Labors..
on both side the system did create a legal way to abuse the system


Australia was the Lucky Country, Politics and Politicians are to be blame
for the imbalance of the late immigration scams ??? remember the great education scheme for foreign student????
all scams
governement responsible

wealth and stability of the world rely on AMERICA


America sneeze = the world catch the flu
that an old saying...
will they survive??
the battle is on
i do strongly believe in American imperialism.


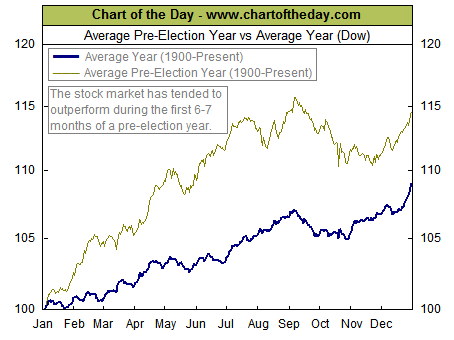
ELECTION YEARS CHART
Chart of the Day Bookmark and Share
Today's chart illustrates how the stock market has performed during the average pre-election year. Since 1900, the stock market has tended to outperform during the first six to seven months of the average pre-election year. For the remainder of the year, pre-election performance has tended to be choppy and slightly subpar. In the end, however, the stock market has tended to outperform during the entirety of the pre-election year. One theory to support this behavior is that the party in power will make difficult economic decisions in the early years of a presidential cycle and then do everything within its power to stimulate the economy during the latter years in order to increase the odds of re-election.

Notes:
- Where's the Dow headed? The answer may surprise you. Find out right now with the Barron's recommended charts only available at Chart of the Day Plus


Why China Risks Repeating an
American Disaster

Monday, 27th June 2011
Melbourne, Australia
By Kris Sayce

  • Why China Risks Repeating an American Disaster
  • A Threat? Or an Opportunity?
.............................................................................................................................................................................
Imagine you knew which Aussie stocks possess an incredible wealth-generating secret...one that could put the equivalent of your annual salary into your bank account - in just one month.

For more details on these incredible stocks, click here
.............................................................................................................................................................................

In today’s Money Morning: Low debt and high savings... Australia in the wrong corner... Production to consumerism - and the risks involved... Uranium, gas or something else... Why China Risks Repeating an American Disaster
"The strength of the real-estate market directly affects the construction, steel, concrete, power and appliance industries. In all, about 50% of China’s GDP is linked to the fate of its real-estate market, according to Standard Chartered economist Stephen Green." - Wall Street Journal
The debt problems in Greece are nothing compared to the China Problem.
At first glance the numbers suggest China is in top shape. Take this chart we found:
Low debt, high savings
Source: Seeking Alpha
In terms of debt levels you want to be in the lower part of the chart. That’s where China is. Where you don’t want to be is the top right corner... that’s where the Anglo-Saxons are - Australia, the U.S. and the U.K.
And for savings rates, you want to be towards the top... again, where China is (although Singapore is in the best position at top right). And the spot to avoid is the bottom part of the chart... again where the U.S. and U.K. are. And where Australia is headed.
But here’s the problem...
China only has low debt levels because Western economies have high debt levels. And China only has a high savings rate because Western economies have a low savings rate.
Which is fine... for a while.
But when your customers run out of credit and can no longer spend, what does a business do?
How to become a consumer nation
The argument in the mainstream is that China will just start buying its own stuff. It will become a consumer nation.
But how will it do that?
At the end of 2010, China had the equivalent of USD$2.85 trillion in foreign reserves.
Of that, USD$1.16 trillion was invested in U.S. government bonds. In other words about 40% of China’s wealth is held in U.S. dollar denominated debt.
The problem for China is if it wants to become a consumer nation, it needs to get rid of those U.S. dollars.
And that’s China’s biggest problem.
First up, selling U.S. dollars will devalue those it still holds. It’d mean China getting less Yuan for their dollars than they’d hoped. And that means less cash for consumers.
The idea that becoming a consumer nation is the solution is ridiculous. As with most poorly thought out solutions, it only appears to work in the short term.
Think back to what we said earlier. If a major customer stops spending, what will that do for a bus iness? That’s right, it spells trouble. Even if previous spending had built a big cash reserve.
So unless the business can find new customers it will need to use savings.
According to the mainstream, that’s just what China needs - start spending everything it has saved. But think about that in a business perspective again. Would it really make sense for a company to blow the budget on expenses at the same time as it lost its main customer?
Of course not. Not if the company wants to remain viable in the long run. What it really needs is to find more customers.
Why China will face the same problems as the U.S.
For instance, think how consumption policy has worked in the past. It’s exactly what the U.S. started doing 50 years ago. It started buying everything it produced... and then more... using credit.
Even being the world’s largest manufacturer wasn’t enough to save it, be cause it consumed more than it exported.
But that’s exac tly the policy China is set to follow. And it’s being cheered on by the West.
Having run out of customers, instead of cutting back on production, the central planners and Westerners think the best idea is to have China spend its savings.
As you can see from the charts above, there’s plenty to spend.
But when you combine falling exports with higher spending, it won’t take long for China’s position to reverse.
What will that mean for Australia?
Funnily enough, it could mean Australia’s status as the "Lucky Country" gets one more stroke of luck. It could mean China’s demand for resources continues as it becomes a consumer rather than an exporter nation.
But don’t jump for joy yet.
Even if the Chinese consumer fills the gap left by Western consumers, the transition won’t be smooth.
Yes, China may keep the Australian economy afloat a while longer, but you shouldn’t fall fo r the mainstream spin that it’ll be painless.
Cheers.

Kris Sayce
Money Morning Australia
A Threat? Or an Opportunity?
By Aaron Tyrrell, Editor, Money Morning
Nine out of 10 households have been promised tax cuts, pension increases and a boost in family payments to help cope with the increased cost of living under the carbon tax.
Nine out of 10 households?!
That means somewhere around eight million taxpayer-funded bribes will be handed out... to Aussies with a household income of less than $150,000... to cover the cost of the new tax...
No wonder poll results in the Sydney Morning Herald reveal the carbon tax is more hated than ever.
Now you should take poll results with a fistful of salt. But it doesn’t matter.
The carbon tax WILL come in, in some form, no matter who has the powe r.
So it’s time to stop griping and start looking for opportunities.
According to Diggers & Drillers editor, Dr Alex Cowie, uranium stocks could be back on the up as we move into the second half of this year.
Why?
Well, all the fuss about these carbon belchers could leave the door ajar for uranium to trumpet its case as the clean, green and reliable alternative to dirty coal. (You can read what Alex had to say in full in the Daily Reckoning here.)
Although it may take a while to shake off the Fukushima blues.
If you want an example of how uranium stocks have fared since the Japan crisis, the following three stocks have dropped an average 45.53%:
PepinNini Minerals Ltd (ASX:PNN), U3O8 Ltd (ASX:UT O) and Thundelarra Exploration Ltd (ASX:THX).
Are any of them any good? We don’t know. But they’re cheap. The priciest will set you back less than 30 cents a share.
Although Australian Wealth Gameplan editor, Dan Denning would argue there’s good reason for that. In an advanced note to the special report he’s due to release, Dan said the Age of Oil will give way to the Golden Age of Gas.
That seems to make sense. Gas is proven and compared to nuclear energy, low cost.
Or maybe you should forget energy and start looking for other opportunities.
Money Morning reader, Geoff W. wrote in last week to point out property developers could be set to double their money at a carbon price of just $10 a tonne. I’m still looking into this story - it seems to be buried under piles of clauses, bullet points and addendums in pa rliamentary papers - and will let you know what I find...
More to come... but it wouldn’t be the first time property developers have come up with an excuse for why property must double!
Aaron Tyrrell
Editor, Money Morning
PS. Dan’s special report on oil, natural gas and the Middle East is due any day. Keep an eye on your inbox over the next few days. In our view it could be the most important piece of research you read this year...
Related Articles
Why You Shouldn't Buy China
Which Commodity is Set to Take Off Next?
Is It Time to Buy This Unloved Energy Play?
The Petro Dollar Standard in Crisis
Why I'm Flying the Flag for China
From the Archives...
Why This is a New Golden Age for Energy Stocks
2011-06-24 - Kris Sayce
The RBA Strums While the Australian Economy Burns
2011-06-23 - Kris Sayce
Beware the Sub-Prime Food Market
2011-06-22 - Kris Sayce
Is OPEC Following Michael Corleone's Advice?< /strong>
2011-06-21 - Kris Sayce

The Depression You Better Hope We Have
2011-06-20 - Kris Sayce

For editorial enquiries and feedback, email moneymorning@moneymorning.com.au


.......................................................

Premium Resources for Money Morning Readers:

Australian Small-Cap Investigator: Uncovering the most promising small-cap shares on the ASX - Trial Subscription

Diggers & Drillers: Australia's finest publication for the resource investor - Trial Subscription

Australian Wealth Gameplan: An alternative way to manage your investments and help you to build real, lasting wealth. - Trial Subscription

Slipstream Trader: Maximise the overall return you get on your large cap stock portfolio by spotting and acting on 'Slipstream' signals. - Trial Subscription
SoundMoney
SoundInvestments
:
Greg Canavan's fortnightly report on Australia's most undervalued stocks includes a full portfolio of current buy, sell, and hold recommendations - for you to incorporate into your financial planning as you see fit.. - Trial Subscription


Free Resources for Money Morning Readers:

Daily Reckoning: Independent and critical perspective on the Australian and global investment markets. - Free Subscription

.......................................................

.......................................................

"Multiple chances to spin grubstakes into 'dream hauls' in the time it takes to need a new haircut..."

Slips tream Trader Murray Dawes is going to deliver a whole new calibr e of short-term, higher-risk, greater-return trades on TOP of his regular trades.

You should only trade these alerts if you have a very high risk tolerance.

To learn more about how Murray is going for triple-digit gains inside three months, watch this video presentation.


.......................................................


.......................................................

The secret deal that rig ged global silver prices - and one Aussie stock set to benefit...

How a silver price manipulation scandal, a hit-and-run accident and a courageous whistleblower have handed you the chance to capitalise on the silver boom - before prices surge again in 2011.

For full details click here.


.......................................................

Australia pension and superfund

The great Australian superannuation fraud

By Alex Messenger
16 August 2010

Returns on Australian compulsory superannuation savings, a scheme sold to workers as a substitute for the old-age pension, have barely surpassed the rate of inflation over the last 14 years, according to official figures compiled by the government-funded Australian Broadcasting Corporation (ABC). These figures are proof that the superannuation system, which Labor and the trade unions proclaim as their “proudest achievement”, is one of the greatest swindles in Australian history.

According to the ABC’s compilation of figures released annually by the Australian Prudential Regulation Authority, the average annual return on superannuation investments between 1997 and 2009 was just 3 percent, as compared to an inflation rate across the same period of 2.8 percent. Taken over past decade, superannuation funds have returned less than the inflation rate—meaning that workers would have been better off simply putting their money in the bank.

The figures are partly explained by market volatility, especially the huge losses during the initial stages of the global financial crisis, and by poor investment decisions on the part of superannuation funds managers. Just as importantly though, the risible returns are all that is left over once investment advisors and fund managers, including trade union bureaucrats, take their hefty slice. A staggering $A17 billion in fees—or $48 million per day—is siphoned off each year from workers’ savings. As the ABC pointed out, this sum alone would be sufficient to fund the entire Australian old age pension system. Yet none of the major parties—Labor, Liberal or the Greens—has commented on these extraordinary figures during the current election campaign, much less on the question of old age incomes more generally.

Compulsory superannuation, introduced by the Keating Labor government in 1992, involved an obligatory employer contribution of 3 percent of each worker’s wage to superannuation funds, which would then be invested in Australian securities, especially the stock market. The chief aim was to transfer a large pool of capital into Australian investment banks, which would then be in a position to punch above their weight on the global stage. In other words, there is a direct link between Labor’s super system, the refusal of successive governments to increase the poverty-level old-age pension and the increasing financialisation of the Australian economy.

The trade unions were involved from the outset. The scheme was a key plank of the “Accord” reached by trade unions and the Labor government to suppress real wages, boost “international competitiveness” and end worker militancy. Union leaders are now involved in the management of superannuation funds worth billions of dollars and thus have a direct stake in ensuring the ongoing implementation of pro-market policies to boost the financial markets.

By 1996 the employer contribution rate had risen to 9 percent. However, with the assistance and support of the unions, this levy was compensated by the abolition or reduction of wage increases. In other words, the compulsory employer contributions were, in effect, paid by the workers themselves.

By 2010, the Australian superannuation pool had risen to $1.17 trillion, making Australia the largest per capita holder of superannuation funds in the world and the fourth largest in gross terms. The figure is equivalent to 100 percent of GDP. Superannuation funds own 26 percent of shares on the Australian stock exchange. As part of Labor’s original deal with the unions, about a quarter of the superannuation pool is controlled by the unions in so-called “industry” superfunds.

In this year’s budget, handed down in May, Labor promised the unions and the finance industry that it would increase compulsory superannuation contributions from 9 to 12 percent of wages by 2019. In line with the current model, then Prime Minister Kevin Rudd invited employers, at the time of the budget, to take the new super impost “into account when negotiating future wage agreements”. According to Labor’s estimates, a further 3 percent increase in super contributions will add $85 billion to Australia’s superannuation pool in the next decade, and more than $500 billion by 2037. The stakes for Australian capitalism in maintaining and expanding the current superannuation system are therefore huge. Finance sector research company Rice Warner estimates that within 15 years, total superannuation holdings will have increased to $A2.7 trillion.

According to Jeff Breshnahan, head of superannuation research firm SuperRatings, the bulk of the $17 billion from compulsory super investments—about $9 billion—goes to well-paid investment managers, whose salaries are, even by finance industry standards, “incredibly high”. As Mike Rafferty, a researcher at the University of Sydney points out, “average wage and salary earners…are subsidising massive salaries that go to fund managers.”

Moreover, fund managers receive these huge salaries regardless of whether their investment decisions increase or reduce workers savings over the course of a given year. Their pay is calculated not on return rates, but on the size of funds under management. Because 9 percent of workers’ wages will roll into the share market regardless of market performance, management salaries are guaranteed. Further, as the ABC pointed out, the vast bulk of the $1.17 trillion super pool is made up of contributions, not of returns on investments. Contributions have been boosted by a series of tax concessions engineered to make superannuation a superficially attractive investment for higher income workers. Prior to the eruption of the global financial crisis in 2007-08, tax incentives introduced by the Howard Coalition government caused a sudden exodus of household assets into super funds. Some $381 billion, about a third of the total $1.17 trillion super pool, was added in the years 2005 to 2007.

The most powerful indictment of the compulsory superannuation system is abundant proof that most workers will still be dependent on the poverty-level pension in their retirement. In other words, despite contributing 9 percent of their wages to Australian superannuation funds, and thus the stock market, every week for the past 15 years, most Australians still have superannuation accounts of less than $70,000. As former Prime Minister Kevin Rudd admitted earlier this year, “a low-income earner on half of average weekly ordinary time earnings [that is, on $31,000 per year] would expect to be 80 percent reliant on the age pension after retirement.”

The solution put forward by the superannuation industry, government and the unions is not to increase the aged pension—which has continued to fall in real terms over the last 20 years—but to increase the retirement age for eligibility for the pension. Under plans unveiled by Labor in the 2009 budget, the Australian government will increase the pension age from 65 to 67 in 2019 —the first increase in the male retirement age since aged pensions were introduced in 1909. Given business demands for budget austerity, the proposed change could well be brought forward. Treasurer Wayne Swan said earlier this year that unless the pension age was increased substantially, society could not afford to look after its elderly: “The blue-collar workforce is impacted upon by the stress on their bodies over time, I openly acknowledge that. But what we have to do is go back to basics here… if we don’t make these changes, the system may not be viable.” Given that the amount siphoned off in superannuation fees could pay for pensions, the statement is a complete lie. Swan’s comments underscore the degree to which he, the Labor government and the whole political establishment is in the thrall of big business—more specifically, of the powerful finance sector—that participated enthusiastically in the worldwide speculative orgy that precipitated the current global economic crisis.

Click here for full coverage of the SEP 2010 election campaign

Authorised by N. Beams, 307 Macquarie St, Liverpool, NSW 2170

Australia famous Stockmarket celebritiies


every boom has some Famous Celebrities
that one never can forget,
for the contributions to the country....

Every stock has a heart


the market never lies..
the market anticipate... react...decide on
insiders manipulations protected by corporates laws,
with intentions and understanding of their iundertaking...
in many cases accounting at work???
remember every stock got a project, or the smell of a project???
most of the projects are not feasible, or never existed??
cant not be proved unfortunately

you have to decide who tell a lie

Financial strategies 2012

 as 30 june 2011 all positions reentered at MV value and welcome to
FINANCIAL YEAR 2012
all markets in correction mode   

looking   and analyzing trend line - support line - cycles projections
extreme caution needed when entering a position


XXXXXXXXXXXXX 2011XXXXXXXXXXXXXX

watching the market very closely..
the pennyshares seems to run..
many stocks approaching top of cycle
will sell into the momentum
MISSION ACCOMPLISHED   for 2011


 DISTRIBUTION TIME ?????
Commentary: While Tuesday's( firts week january ) down day in the markets was relatively tame as far as the major indexes were concerned, many former market leaders suffered a high volume selloff. Even though one distribution day isn’t usually enough to change the overall trend in a stock, it does shock current market participants and will likely have a residual effect moving forward. Often when a stock suffers a violent down day, the low will act as a resistance level as worried market participants begin to sell on any bounces back into the selloff day's price range.


Why the Bullish Forecasts for 2011 Might Hit a Few Snags

leadimage
01/10/11 Laguna Beach, California – The Dow Jones Industrial Average did not produce any explosive gains during the first five days of the New Year, but it did produce a “quiet” gain of almost 100 points –continuing a recent trend of steady, if unremarkable, progress.
The Dow has advanced for seven consecutive weeks, but has gained only about 100 points per week during that timeframe. So the recent price action does not feel over-the-top exuberant. Instead, it feels steady, reliable…almost predictable.
Everyone knows the market will go up next week, just like it went up last week…and the week before that. This seeming predictability is simply a different strain of irrational exuberance. When the market seems as soothing as a Corona Beer commercial, the “fear instinct” goes dormant. Investors forget to worry.
But a Corona beer commercial isn’t reality. And neither is a tranquil, friendly stock market.
Nevertheless, most Wall Street strategists have been falling all over one another to proclaim their bullish forecasts for 2011. Goldman Sachs strategist, David Kostin, is looking for a 17% rally in the S&P 500 Index this year, while most of his Wall Street counterparts are expecting at least low double-digit gains.
We hope these hopeful prognostications come to fruition. In general, up is much better than down. But it’s a long year ahead and the road to gains may not be as direct and “predictable” as the Dow’s recent performance might suggest.
The market might encounter a few bumps along the way. In fact, David Rosenberg, economist for Canada’s Gluskin Sheff, expects the market to encounter a few bumps very soon. “Signs of excessive exuberance abound,” says Rosenberg.
In particular:
  • The VIX index, at 17.5x, is back to where it was last April. Remember what happened next.
  • Investors Intelligence bullish sentiment is back to where it was at the all-time market highs of October 2007.
  • The non-commercial accounts on the CME have recently opened up a considerable net speculative long position in equities, particularly the QQQ’s (NASDAQ stocks).
  • Market leadership is narrowing, as Bob Farrell has been busy pointing out.
  • The number of short-selling positions slid 2.2% in the first half of December on the NYSE; and by 2.8% on the NASDAQ. The bears are running scared.
  • As Kelly Evans asserted last week, the AAII investor sentiment poll has been above its historical norm now for 17 weeks running – the longest stretch in six years.
  • Since July, margin debt has exploded by 16% to $274 billion, the most since September 2008 when people still thought we were in a soft landing.
  • Equity mutual funds and ETF’s took in $24 billion in December (TrimTabs data)… The last time we saw retail inflows like this into equities was last March…just ahead of a 17% correction.
Meanwhile, over in the housing market, there are absolutely no signs of excessive exuberance. In fact, there are barely any signs of anything, which is just one of the reasons why the housing market may offer one of the most compelling investment opportunities of 2011.
Eric Fry
for The Daily Reckoning
Author Image for Eric Fry

Eric Fry

Eric J. Fry, Agora Financial’s Editorial Director, has been a specialist in international equities for nearly two decades. He was a professional portfolio manager for more than 10 years, specializing in international investment strategies and short-selling.  Following his successes in professional money management, Mr. Fry joined the Wall Street-based publishing operations of James Grant, editor of the prestigious Grant's Interest Rate Observer. Working alongside Grant, Mr. Fry produced Grant's International and Apogee Research —  institutional research products dedicated to international investment opportunities and short selling.
Mr. Fry subsequently joined Agora Inc., as Editorial Director. In this role, Mr. Fry  supervises the editorial and research processes of numerous investment letters and services. Mr. Fry also publishes investment insights and commentary under his own byline as Editor of The Daily Reckoning. Mr. Fry authored the first comprehensive guide to investing internationally with American Depository Receipts.  His views and investment insights have appeared in numerous publications including Time, Barron's, Wall Street Journal, International Herald Tribune, Business Week, USA Today, Los Angeles Times and Money.
Special Report: Why We Left Wall Street... And How You Can Grab Three FREE Issues of Our Most Important New Service. Learn More...

Read more: Why the Bullish Forecasts for 2011 Might Hit a Few Snags http://dailyreckoning.com/why-the-bullish-forecasts-for-2011-might-hit-a-few-snags/#ixzz1AjKXmQvj


PREDICTIONS 2011


GOLDMANSACHS  BULLISH 2011

Related Quotes

SymbolPriceChange
BKX.TO4.060.00
Chart for BNK PETROLEUM INC.
GS169.760.00
Chart for Goldman Sachs Group, Inc. (The)
KBE26.190.00
Chart for SPDR KBW Bank ETF
{"s" : "bkx.to,gs,kbe","k" : "a00,a50,b00,b60,c10,g00,h00,l10,p20,t10,v00","o" : "","j" : ""}
On Tuesday 7 December 2010, 5:49 EST
Goldman Sachs is bullish on the U.S. economy for 2011, and forecasts U.S. stocks will see their third straight year of gains.
The investment banking powerhouse sees the S&P 500 (INDEX: .SPX) gaining nearly 25 percent to a level of 1450 in the next 12 months, fueled by strong corporate profits, easy monetary policies and an improving U.S. economy.
Goldman (NYSE:GS - News) sees stocks gaining as the U.S. economic growth accelerating from 2.5 to 4 percent by the end of 2012, but says investors will continue to have doubt. (Watch comments by Goldman's Chief U.S. Investment Strategist David Kostin in the video clip later in this story.)
"Despite these many positives, the equity investing landscape is hard to decipher," Goldman's U.S. investment strategy team writes in its 2011 U.S. equity forecast, which is headlined "Easy Money, Hard Market."
Investors remain understandably skeptical about positive economic data, Goldman says, because the improvement is coming from a fairly low base. But the strategists argue with strong corporate balance sheets, low inflation and interest rates that "the path of earnings growth has rarely been smoother."
Goldman is recommending its clients increase their investments in cyclical sectors. It continues to overweight technology, and has raised its outlook on energy and financials to overweight from neutral.
Goldman also recommends investors underweight defensive sectors like health care, consumer staples and utilities.
Long U.S. Bank Stocks
Goldman's global investment team rates U.S. Large Cap Commercial Banks among its "Top Trades for 2011." The firm expects financial sector earnings to grow 24 percnet, with the economic recovery leading to improving loan demands and credit trends for the big banks. It also believes the large cap banks will get back to paying dividends in 2011.
The firm recommends clients gain exposure to the sector through the KBW Bank Index (Toronto:BKX.TO - News) or SPDR ETF based on the index (NYSEArca:KBE - News).
Commodities: Gold, Oil Higher in 2011

Goldman believes low U.S. interest rates will continue to underpin the rally in commodities like gold. The firm expects the precious metal futures to climb to $1,690 an ounce by the end of 2011 and continue to move higher.
But the firm believes prices will likely peak at $1,750 an ounce in 2012, as the U.S. recovery will see interest rates move higher.
Goldman's commodities strategists also see oil futures rising to $105 dollars a barrel in 2011, and demand improving along with the U.S. economy. The firm notes, "Energy is historically the best performing sector when the ISM is above 50, which seems increasingly likely given strong October ISM and our US economists upgrade to their 2011 growth outlook."
Currencies: Top Trade, Bad Call
Among the risks Goldman sees for 2011 is moderating growth in China, as Beijing tries to reign in inflation.
While its economic teams saw the improvement in U.S. growth lagging emerging markets in 2010, Goldman strategists believe the trend has reversed over the last six months, "with our US economics team now more constructive on domestic growth, but our China economists expecting monetary tightening through increases in interest rates and reserve requirements over the next three to six months."
One of the firm's top trades for 2011 involves shorting the U.S. dollar/Chinese yuan exchange. The firm argues low rates in the U.S. will keep the dollar lower, while China will have to let its currency rise next year, as it undertakes policies to control growth. "Rising external political pressure on the CNY from the US and other countries, as well as the threat of escalating trade tensions, expose China's dependence on exports. More gradual CNY appreciation would help alleviate these tensions."
While most of Goldman's 2010 predictions on the U.S. stock market, commodities prices and economic growth have generally proven right on the money, its crystal ball was much more cloudy when it came to some key currency calls.
One of Goldman's top trades for 2010 proved a big loser. The firm's currency strategists recommended shorting the New Zealand dollar and going long the British pound, saying at the time, "We are more bullish on Sterling, linked to a stronger cyclical momentum in response to a large easing in financial conditions."
But the Kiwi has been strong performer this year on the strength of the country's rising commodity prices. The analyst who made that call reportedly apologized to clients in a recent note, saying it may have results in losses of more 12 percent.
Even Babe Ruth never batted a thousand. 

When Goldman says go long that means they are short.


for more go to the link
http://au.finance.yahoo.com/news/Goldman-Sachs-2011-Forecast-cnbc-4210599228.html?x=0&.v=1

BUBBLE  TALK

interesting  video